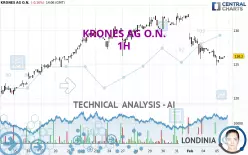
KRONES AG O.N. - 1H - Technical analysis published on 02/05/2025 (GMT)
- 124
- 0
Click here for a new analysis!
- Timeframe : 1H
- - Analysis generated on
- Status : INVALID

Summary of the analysis

Additional analysis
Quotes
KRONES AG O.N. rating 126.2 EUR. On the day, this instrument lost -0.16% with the lowest point at 124.8 EUR and the highest point at 126.2 EUR. The deviation from the price is +1.12% for the low point and 0% for the high point.Here is a more detailed summary of the historical variations registered by KRONES AG O.N.:
Near a new HIGH record (5 years)
Type : Bullish
Timeframe : Weekly
Near a new LOW record (1st january)
Type : Bearish
Timeframe : Weekly
Near a new LOW record (1 month)
Type : Bearish
Timeframe : Weekly
Technical
A technical analysis in 1H of this KRONES AG O.N. chart shows a sharp bearish trend. The signals given by moving averages are 85.71% bearish. This strong bearish trend is confirmed by the strong signals currently being given by short-term moving averages. The Central Indicators scanner detects a bearish signal on moving averages that could impact this trend:
Moving Average bearish crossovers : MA50 & MA100
Type : Bearish
Timeframe : 1 hour
In fact, Central Analyzer took into account 18 technical indicators and the result was as follows: 6 are bullish, 5 are neutral and 7 are bearish. Central Indicators, the detector scanner for these technical indicators recently detected a signal:
Pivot points : price is under support 1
Type : Neutral
Timeframe : Weekly
An analysis of the price chart with the Central Patterns scanner (detector of chart patterns and resistances and supports) shows a result that can have an impact on the price change:
Near horizontal support
Type : Bullish
Timeframe : 1 hour
No result was found by the Central Candlesticks scanner on Japanese candlesticks.
| S3 | S2 | S1 | R1 | Price | R2 | R3 | |
|---|---|---|---|---|---|---|---|
| ProTrendLines | 120.6 | 122.2 | 123.6 | 126.2 | 126.2 | 127.2 | 129.8 |
| Change (%) | -4.44% | -3.17% | -2.06% | 0% | - | +0.79% | +2.85% |
| Change | -5.6 | -4.0 | -2.6 | 0 | - | +1.0 | +3.6 |
| Level | Major | Minor | Major | Intermediate | - | Intermediate | Major |
To determine price objectives, it is also possible to use the pivot points. Here is the price position in relation to pivot points:
| Pivot points | S3 | S2 | S1 | PP | R1 | R2 | R3 |
|---|---|---|---|---|---|---|---|
| Standard | 124.4 | 125.2 | 125.8 | 126.6 | 127.2 | 128.0 | 128.6 |
| Camarilla | 126.0 | 126.1 | 126.3 | 126.4 | 126.5 | 126.7 | 126.8 |
| Woodie | 124.3 | 125.2 | 125.7 | 126.6 | 127.1 | 128.0 | 128.5 |
| Fibonacci | 125.2 | 125.7 | 126.1 | 126.6 | 127.1 | 127.5 | 128.0 |
| Pivot points | S3 | S2 | S1 | PP | R1 | R2 | R3 |
|---|---|---|---|---|---|---|---|
| Standard | 121.5 | 123.9 | 127.9 | 130.3 | 134.3 | 136.7 | 140.7 |
| Camarilla | 130.2 | 130.8 | 131.4 | 132.0 | 132.6 | 133.2 | 133.8 |
| Woodie | 122.4 | 124.3 | 128.8 | 130.7 | 135.2 | 137.1 | 141.6 |
| Fibonacci | 123.9 | 126.3 | 127.8 | 130.3 | 132.7 | 134.2 | 136.7 |
| Pivot points | S3 | S2 | S1 | PP | R1 | R2 | R3 |
|---|---|---|---|---|---|---|---|
| Standard | 111.2 | 115.6 | 123.8 | 128.2 | 136.4 | 140.8 | 149.0 |
| Camarilla | 128.5 | 129.7 | 130.9 | 132.0 | 133.2 | 134.3 | 135.5 |
| Woodie | 113.1 | 116.6 | 125.7 | 129.2 | 138.3 | 141.8 | 150.9 |
| Fibonacci | 115.6 | 120.4 | 123.4 | 128.2 | 133.0 | 136.0 | 140.8 |
Numerical data
The following is the status of technical indicators and moving averages registered at the time this technical analysis was created:
| RSI (14): | 37.20 | |
| MACD (12,26,9): | -1.0000 | |
| Directional Movement: | -25.5 | |
| AROON (14): | -71.4 | |
| DEMA (21): | 125.6 | |
| Parabolic SAR (0,02-0,02-0,2): | 126.9 | |
| Elder Ray (13): | -0.6 | |
| Super Trend (3,10): | 127.6 | |
| Zig ZAG (10): | 126.0 | |
| VORTEX (21): | 0.8000 | |
| Stochastique (14,3,5): | 42.10 | |
| TEMA (21): | 125.3 | |
| Williams %R (14): | -53.80 | |
| Chande Momentum Oscillator (20): | -1.4 | |
| Repulse (5,40,3): | 0.3000 | |
| ROCnROLL: | 2 | |
| TRIX (15,9): | -0.1000 | |
| Courbe Coppock: | 2.10 |
| MA7: | 129.0 | |
| MA20: | 126.7 | |
| MA50: | 122.6 | |
| MA100: | 123.0 | |
| MAexp7: | 126.1 | |
| MAexp20: | 127.0 | |
| MAexp50: | 128.3 | |
| MAexp100: | 128.2 | |
| Price / MA7: | -2.17% | |
| Price / MA20: | -0.39% | |
| Price / MA50: | +2.94% | |
| Price / MA100: | +2.60% | |
| Price / MAexp7: | +0.08% | |
| Price / MAexp20: | -0.63% | |
| Price / MAexp50: | -1.64% | |
| Price / MAexp100: | -1.56% |
News
The latest news and videos published on KRONES AG O.N. at the time of the analysis were as follows:
- EQS-News: Krones significantly improves revenue and profitability in first three quarters of 2024
- EQS-News: Krones reports very good first half-year 2024 – significant increase in revenue and profitability
- EQS-News: Krones to continue profitable growth – medium-term targets set for 2028
- EQS-News: Krones continues profitable growth path
- EQS-News: Krones successfully completes acquisition of injection molding technology company Netstal
About author
Online


Add a comment
Comments
0 comments on the analysis KRONES AG O.N. - 1H