HELLA GMBH+CO. KGAA O.N. - Daily - Technical analysis published on 11/22/2019 (GMT)
- 267
- 0
- Who voted?
Click here for a new analysis!
- Timeframe : Daily
- - Analysis generated on
- Status : TARGET REACHED
Summary of the analysis

Additional analysis
Quotes
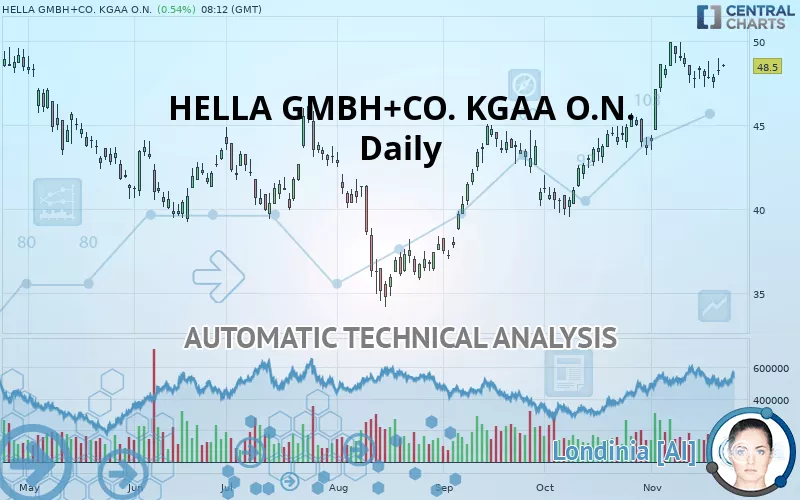
The HELLA GMBH+CO. KGAA O.N. price is 48.50 EUR. The price registered an increase of +0.54% on the session and was between 48.42 EUR and 48.64 EUR. This implies that the price is at +0.17% from its lowest and at -0.29% from its highest.A bullish gap was detected at the opening by the Central Gaps scanner. There are a lot of buyers and they have the upper hand in the very short term.
Opening Gap UP
Type : Bullish
Timeframe : Openning
So that you have an overall view of the price change, here is a table showing the variations over several periods:
Near a new HIGH record (1 year)
Type : Bullish
Timeframe : Weekly
Near a new HIGH record (1st january)
Type : Bullish
Timeframe : Weekly
Near a new HIGH record (1 month)
Type : Bullish
Timeframe : Weekly
Technical
Technical analysis of HELLA GMBH+CO. KGAA O.N. in Daily shows a strongly overall bullish trend. 92.86% of the signals given by moving averages are bullish. The overall trend is supported by the strong bullish signals from short-term moving averages. The Central Indicators market scanner currently does not detect any result that concerns moving averages.
In fact, only 7 technical indicators out of 18 studied are currently positioned bullish. Other results related to technical indicators were also found by the Central Indicators scanner:
Price is back over the pivot point
Type : Bullish
Timeframe : Daily
Price is back under the pivot point
Type : Bearish
Timeframe : Weekly
Momentum indicator is back under 0
Type : Bearish
Timeframe : Daily
Central Patterns, the scanner specializing in chart patterns, did not identify any signals.
No result was found by the Central Candlesticks scanner on Japanese candlesticks.
| S3 | S2 | S1 | Price | R1 | R2 | R3 | |
|---|---|---|---|---|---|---|---|
| ProTrendLines | 43.62 | 44.94 | 46.10 | 48.50 | 49.23 | 53.44 | 58.75 |
| Change (%) | -10.06% | -7.34% | -4.95% | - | +1.51% | +10.19% | +21.13% |
| Change | -4.88 | -3.56 | -2.40 | - | +0.73 | +4.94 | +10.25 |
| Level | Major | Intermediate | Intermediate | - | Major | Minor | Intermediate |
Attention could also be paid to pivot points to set price objectives:
| Pivot points | S3 | S2 | S1 | PP | R1 | R2 | R3 |
|---|---|---|---|---|---|---|---|
| Standard | 46.85 | 47.43 | 47.83 | 48.41 | 48.81 | 49.39 | 49.79 |
| Camarilla | 47.61 | 47.69 | 47.76 | 47.84 | 47.92 | 48.42 | 48.51 |
| Woodie | 46.58 | 46.90 | 47.42 | 47.74 | 48.26 | 48.58 | 49.10 |
| Fibonacci | 46.87 | 47.19 | 47.39 | 47.71 | 48.03 | 48.23 | 48.55 |
| Pivot points | S3 | S2 | S1 | PP | R1 | R2 | R3 |
|---|---|---|---|---|---|---|---|
| Standard | 44.28 | 45.74 | 47.00 | 48.46 | 49.72 | 51.18 | 52.44 |
| Camarilla | 47.51 | 47.76 | 48.01 | 48.26 | 48.51 | 48.76 | 49.01 |
| Woodie | 44.18 | 45.69 | 46.90 | 48.41 | 49.62 | 51.13 | 52.34 |
| Fibonacci | 45.74 | 46.78 | 47.42 | 48.46 | 49.50 | 50.14 | 51.18 |
| Pivot points | S3 | S2 | S1 | PP | R1 | R2 | R3 |
|---|---|---|---|---|---|---|---|
| Standard | 34.01 | 36.77 | 40.19 | 42.95 | 46.37 | 49.13 | 52.55 |
| Camarilla | 41.92 | 42.49 | 43.05 | 43.62 | 44.19 | 44.75 | 45.32 |
| Woodie | 34.35 | 36.94 | 40.53 | 43.12 | 46.71 | 49.30 | 52.89 |
| Fibonacci | 36.77 | 39.13 | 40.59 | 42.95 | 45.31 | 46.77 | 49.13 |
Numerical data
The following is the status of the technical indicators and moving averages at the time of publication of this technical analysis:
| RSI (14): | 63.22 | |
| MACD (12,26,9): | 1.1600 | |
| Directional Movement: | 12.55 | |
| AROON (14): | 21.43 | |
| DEMA (21): | 48.88 | |
| Parabolic SAR (0,02-0,02-0,2): | 46.79 | |
| Elder Ray (13): | 0.70 | |
| Super Trend (3,10): | 45.52 | |
| Zig ZAG (10): | 48.46 | |
| VORTEX (21): | 1.1200 | |
| Stochastique (14,3,5): | 62.73 | |
| TEMA (21): | 48.95 | |
| Williams %R (14): | -47.97 | |
| Chande Momentum Oscillator (20): | 0.20 | |
| Repulse (5,40,3): | -0.3800 | |
| ROCnROLL: | 1 | |
| TRIX (15,9): | 0.4500 | |
| Courbe Coppock: | 12.57 |
| MA7: | 47.97 | |
| MA20: | 47.37 | |
| MA50: | 44.73 | |
| MA100: | 42.36 | |
| MAexp7: | 48.04 | |
| MAexp20: | 47.23 | |
| MAexp50: | 45.14 | |
| MAexp100: | 43.62 | |
| Price / MA7: | +1.10% | |
| Price / MA20: | +2.39% | |
| Price / MA50: | +8.43% | |
| Price / MA100: | +14.49% | |
| Price / MAexp7: | +0.96% | |
| Price / MAexp20: | +2.69% | |
| Price / MAexp50: | +7.44% | |
| Price / MAexp100: | +11.19% |
News
The latest news and videos published on HELLA GMBH+CO. KGAA O.N. at the time of the analysis were as follows:
- DGAP-News: HELLA GmbH & Co. KGaA: HELLA sells relay business to Hongfa
- DGAP-News: HELLA Annual General Meeting approves special dividend and elects representatives for Shareholder Committee and Supervisory Board
- DGAP-News: HELLA GmbH & Co. KGaA: HELLA experiences slow start to the new fiscal year as expected
- DGAP-News: HELLA GmbH & Co. KGaA: Exceed Possibilities: HELLA presents lighting and electronic solutions for future mobility at IAA 2019
- DGAP-News: HELLA GmbH & Co. KGaA: HELLA successfully places EUR 500 million corporate bond on the market
About author

Online


Add a comment
Comments
0 comments on the analysis HELLA GMBH+CO. KGAA O.N. - Daily