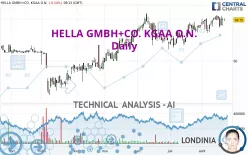
HELLA GMBH+CO. KGAA O.N. - Daily - Technical analysis published on 08/22/2022 (GMT)
- 231
- 0
Click here for a new analysis!
- Timeframe : Daily
- - Analysis generated on
- Status : TARGET REACHED

Summary of the analysis

Additional analysis
Quotes
The HELLA GMBH+CO. KGAA O.N. rating is 69.75 EUR. The price is lower by -0.14% since the last closing with the lowest point at 69.45 EUR and the highest point at 70.15 EUR. The deviation from the price is +0.43% for the low point and -0.57% for the high point.The Central Gaps scanner detects a bearish opening. A small advantage for sellers in the very short term.
Bearish opening
Type : Bearish
Timeframe : Openning
Here is a more detailed summary of the historical variations registered by HELLA GMBH+CO. KGAA O.N.:
Near a new HIGH record (5 years)
Type : Bullish
Timeframe : Weekly
Near a new HIGH record (1 year)
Type : Bullish
Timeframe : Weekly
Near a new HIGH record (1st january)
Type : Bullish
Timeframe : Weekly
Near a new LOW record (1 month)
Type : Bearish
Timeframe : Weekly
Technical
A technical analysis in Daily of this HELLA GMBH+CO. KGAA O.N. chart shows a strongly bullish trend. 92.86% of the signals given by moving averages are bullish. This strongly bullish trend is supported by the strong bullish signals given by short-term moving averages. The Central Indicators market scanner is currently detecting a bullish signal that could impact this trend:
Bullish trend reversal : Moving Average 50
Type : Bullish
Timeframe : Daily
An assessment of technical indicators shows a moderate bullish signal.
No additional result has been identified by Central Indicators, the scanner specialised in technical indicators.
An analysis of the price chart with the Central Patterns scanner (detector of chart patterns and resistances and supports) shows several results that can have an impact on the price change:
Near horizontal resistance
Type : Bearish
Timeframe : Daily
Near resistance of channel
Type : Bearish
Timeframe : Daily
Near resistance of triangle
Type : Bearish
Timeframe : Daily
The Central Candlesticks scanner which studies Japanese candlesticks did not detect anything.
| S3 | S2 | S1 | Price | R1 | |
|---|---|---|---|---|---|
| ProTrendLines | 62.00 | 64.18 | 66.17 | 69.75 | 71.10 |
| Change (%) | -11.11% | -7.99% | -5.13% | - | +1.94% |
| Change | -7.75 | -5.57 | -3.58 | - | +1.35 |
| Level | Major | Minor | Major | - | Major |
Attention could also be paid to pivot points to set price objectives:
| Pivot points | S3 | S2 | S1 | PP | R1 | R2 | R3 |
|---|---|---|---|---|---|---|---|
| Standard | 66.83 | 67.62 | 68.73 | 69.52 | 70.63 | 71.42 | 72.53 |
| Camarilla | 69.33 | 69.50 | 69.68 | 69.85 | 70.02 | 70.20 | 70.37 |
| Woodie | 67.00 | 67.70 | 68.90 | 69.60 | 70.80 | 71.50 | 72.70 |
| Fibonacci | 67.62 | 68.34 | 68.79 | 69.52 | 70.24 | 70.69 | 71.42 |
| Pivot points | S3 | S2 | S1 | PP | R1 | R2 | R3 |
|---|---|---|---|---|---|---|---|
| Standard | 65.42 | 66.68 | 68.27 | 69.53 | 71.12 | 72.38 | 73.97 |
| Camarilla | 69.07 | 69.33 | 69.59 | 69.85 | 70.11 | 70.37 | 70.63 |
| Woodie | 65.58 | 66.76 | 68.43 | 69.61 | 71.28 | 72.46 | 74.13 |
| Fibonacci | 66.68 | 67.77 | 68.45 | 69.53 | 70.62 | 71.30 | 72.38 |
| Pivot points | S3 | S2 | S1 | PP | R1 | R2 | R3 |
|---|---|---|---|---|---|---|---|
| Standard | 58.55 | 60.85 | 64.70 | 67.00 | 70.85 | 73.15 | 77.00 |
| Camarilla | 66.86 | 67.42 | 67.99 | 68.55 | 69.11 | 69.68 | 70.24 |
| Woodie | 59.33 | 61.24 | 65.48 | 67.39 | 71.63 | 73.54 | 77.78 |
| Fibonacci | 60.85 | 63.20 | 64.65 | 67.00 | 69.35 | 70.80 | 73.15 |
Numerical data
The following is the status of technical indicators and moving averages registered at the time this technical analysis was created:
| RSI (14): | 55.61 | |
| MACD (12,26,9): | 0.7400 | |
| Directional Movement: | 1.61 | |
| AROON (14): | 42.86 | |
| DEMA (21): | 70.00 | |
| Parabolic SAR (0,02-0,02-0,2): | 67.96 | |
| Elder Ray (13): | 0.43 | |
| Super Trend (3,10): | 66.04 | |
| Zig ZAG (10): | 69.75 | |
| VORTEX (21): | 1.0500 | |
| Stochastique (14,3,5): | 78.05 | |
| TEMA (21): | 70.09 | |
| Williams %R (14): | -25.61 | |
| Chande Momentum Oscillator (20): | 2.15 | |
| Repulse (5,40,3): | 0.5100 | |
| ROCnROLL: | 1 | |
| TRIX (15,9): | 0.1700 | |
| Courbe Coppock: | 3.73 |
| MA7: | 69.76 | |
| MA20: | 69.04 | |
| MA50: | 67.25 | |
| MA100: | 64.94 | |
| MAexp7: | 69.64 | |
| MAexp20: | 68.99 | |
| MAexp50: | 67.55 | |
| MAexp100: | 65.68 | |
| Price / MA7: | -0.01% | |
| Price / MA20: | +1.03% | |
| Price / MA50: | +3.72% | |
| Price / MA100: | +7.41% | |
| Price / MAexp7: | +0.16% | |
| Price / MAexp20: | +1.10% | |
| Price / MAexp50: | +3.26% | |
| Price / MAexp100: | +6.20% |
News
The last news published on HELLA GMBH+CO. KGAA O.N. at the time of the generation of this analysis was as follows:
- DGAP-News: HELLA GmbH & Co. KGaA: HELLA significantly outperforms the market and achieves record order intake
- DGAP-News: HELLA GmbH & Co. KGaA: Judith Buss and Andreas Renschler to join HELLA's Shareholder Committee and Supervisory Board as independent members
- DGAP-News: HELLA GmbH & Co. KGaA: Klaus Kühn resigns as Chairman of the Supervisory Board and as a member of HELLA’s Shareholders’ Committee
- DGAP-Adhoc: HELLA GmbH & Co. KGaA: Resignations of the Chairman of the Supervisory Board and the Member of the Shareholders Committee of HELLA GmbH & Co. KGaA, Klaus Kühn
- DGAP-News: HELLA GmbH & Co. KGaA: Exit from joint venture: HELLA agrees sale of HELLA held HBPO shares to Plastic Omnium
About author
Online


Add a comment
Comments
0 comments on the analysis HELLA GMBH+CO. KGAA O.N. - Daily