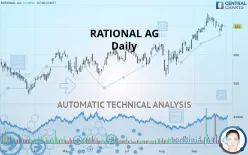
RATIONAL AG - Daily - Technical analysis published on 09/30/2019 (GMT)
- 261
- 0
- Who voted?
Click here for a new analysis!
- Timeframe : Daily
- - Analysis generated on
- Status : LEVEL MAINTAINED

Summary of the analysis

Additional analysis
Quotes
RATIONAL AG rating 650.0 EUR. The price has increased by +0.08% since the last closing with the lowest point at 650.0 EUR and the highest point at 650.0 EUR. The deviation from the price is 0% for the low point and 0% for the high point.The Central Gaps scanner detects a bullish opening marking the presence of buyers ahead of sellers at the opening but not sufficiently marked to allow the price to register a quotation gap.
Bullish opening
Type : Bullish
Timeframe : Openning
A study of price movements over other periods shows the following variations:
Near a new HIGH record (1 year)
Type : Bullish
Timeframe : Weekly
Near a new HIGH record (1st january)
Type : Bullish
Timeframe : Weekly
Near a new HIGH record (1 month)
Type : Bullish
Timeframe : Weekly
Technical
Technical analysis of this Daily chart of RATIONAL AG indicates that the overall trend is strongly bullish. 85.71% of the signals given by moving averages are bullish. The slightly bullish signals given by the short-term moving averages show a weakening of the global trend. An assessment of moving averages reveals several bullish signals that could impact this trend:
Bullish price crossover with Moving Average 20
Type : Bullish
Timeframe : Daily
Bullish price crossover with adaptative moving average 20
Type : Bullish
Timeframe : Daily
The probability of a further increase is slight given the direction of the technical indicators.
Central Indicators, the scanner specialised in technical indicators, has identified these signals:
Price is back over the pivot point
Type : Bullish
Timeframe : Daily
Momentum indicator is back over 0
Type : Bullish
Timeframe : Daily
An analysis of the price chart with the Central Patterns scanner (detector of chart patterns and resistances and supports) shows several results that can have an impact on the price change:
Near horizontal resistance
Type : Bearish
Timeframe : Daily
Near support of channel
Type : Bullish
Timeframe : Daily
The Central Candlesticks scanner which studies Japanese candlesticks did not detect anything.
| S3 | S2 | S1 | Price | R1 | R2 | |
|---|---|---|---|---|---|---|
| ProTrendLines | 533.0 | 571.6 | 598.3 | 650.0 | 670.0 | 694.5 |
| Change (%) | -18.00% | -12.06% | -7.95% | - | +3.08% | +6.85% |
| Change | -117.0 | -78.4 | -51.7 | - | +20.0 | +44.5 |
| Level | Major | Intermediate | Major | - | Major | Major |
To determine price objectives, it is also possible to use the pivot points. Here is the price position in relation to pivot points:
| Pivot points | S3 | S2 | S1 | PP | R1 | R2 | R3 |
|---|---|---|---|---|---|---|---|
| Standard | 630.5 | 635.5 | 644.0 | 649.0 | 657.5 | 662.5 | 671.0 |
| Camarilla | 648.8 | 650.0 | 651.3 | 652.5 | 653.7 | 655.0 | 656.2 |
| Woodie | 632.3 | 636.4 | 645.8 | 649.9 | 659.3 | 663.4 | 672.8 |
| Fibonacci | 635.5 | 640.7 | 643.8 | 649.0 | 654.2 | 657.3 | 662.5 |
| Pivot points | S3 | S2 | S1 | PP | R1 | R2 | R3 |
|---|---|---|---|---|---|---|---|
| Standard | 627.2 | 636.8 | 647.7 | 657.3 | 668.2 | 677.8 | 688.7 |
| Camarilla | 652.9 | 654.7 | 656.6 | 658.5 | 660.4 | 662.3 | 664.1 |
| Woodie | 627.8 | 637.1 | 648.3 | 657.6 | 668.8 | 678.1 | 689.3 |
| Fibonacci | 636.8 | 644.7 | 649.5 | 657.3 | 665.2 | 670.0 | 677.8 |
| Pivot points | S3 | S2 | S1 | PP | R1 | R2 | R3 |
|---|---|---|---|---|---|---|---|
| Standard | 509.0 | 535.0 | 584.5 | 610.5 | 660.0 | 686.0 | 735.5 |
| Camarilla | 613.2 | 620.2 | 627.1 | 634.0 | 640.9 | 647.8 | 654.8 |
| Woodie | 520.8 | 540.9 | 596.3 | 616.4 | 671.8 | 691.9 | 747.3 |
| Fibonacci | 535.0 | 563.8 | 581.7 | 610.5 | 639.3 | 657.2 | 686.0 |
Numerical data
The following is the status of the technical indicators and moving averages at the time of publication of this technical analysis:
| RSI (14): | 55.30 | |
| MACD (12,26,9): | 8.9000 | |
| Directional Movement: | 8.9 | |
| AROON (14): | -57.1 | |
| DEMA (21): | 660.6 | |
| Parabolic SAR (0,02-0,02-0,2): | 666.3 | |
| Elder Ray (13): | 0.7 | |
| Super Trend (3,10): | 629.4 | |
| Zig ZAG (10): | 649.5 | |
| VORTEX (21): | 1.1000 | |
| Stochastique (14,3,5): | 30.50 | |
| TEMA (21): | 659.9 | |
| Williams %R (14): | -68.60 | |
| Chande Momentum Oscillator (20): | 2.5 | |
| Repulse (5,40,3): | 1.2000 | |
| ROCnROLL: | -1 | |
| TRIX (15,9): | 0.3000 | |
| Courbe Coppock: | 3.70 |
| MA7: | 653.5 | |
| MA20: | 651.2 | |
| MA50: | 623.1 | |
| MA100: | 606.9 | |
| MAexp7: | 652.5 | |
| MAexp20: | 647.3 | |
| MAexp50: | 629.5 | |
| MAexp100: | 612.5 | |
| Price / MA7: | -0.54% | |
| Price / MA20: | -0.18% | |
| Price / MA50: | +4.32% | |
| Price / MA100: | +7.10% | |
| Price / MAexp7: | -0.38% | |
| Price / MAexp20: | +0.42% | |
| Price / MAexp50: | +3.26% | |
| Price / MAexp100: | +6.12% |
News
Don"t forget to follow the news on RATIONAL AG. At the time of publication of this analysis, the latest news was as follows:
- DGAP-News: Rational AG on track after six months - growth and margins again in line with expectations
- DGAP-News: RATIONAL AG: Successful start to fiscal year 2019
- DGAP-News: RATIONAL AG: Stable shareholder structure and continuity in the Supervisory Board
- DGAP-News: RATIONAL AG continues to grow successfully
- DGAP-News: RATIONAL AG: Preliminary figures for fiscal year 2018
About author

Online


Add a comment
Comments
0 comments on the analysis RATIONAL AG - Daily