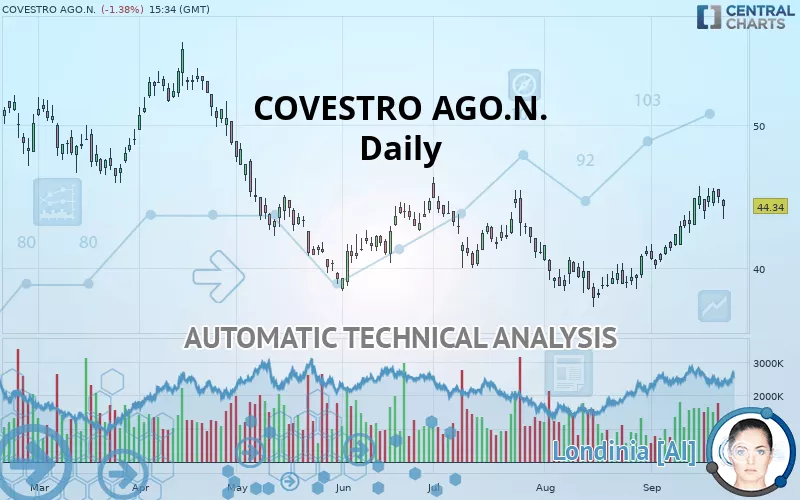
COVESTRO AGO.N. - Daily - Technical analysis published on 09/23/2019 (GMT)
- 355
- 0
- Who voted?
Click here for a new analysis!
- Timeframe : Daily
- - Analysis generated on
- Status : TARGET REACHED

Summary of the analysis

Additional analysis
Quotes
The COVESTRO AGO.N. rating is 44.34 EUR. The price is lower by -1.38% since the last closing with the lowest point at 43.46 EUR and the highest point at 44.81 EUR. The deviation from the price is +2.02% for the low point and -1.05% for the high point.A bearish opening was detected by the Central Gaps scanner. Sellers are trying to impose a bearish trend in the very short term.
Bearish opening
Type : Bearish
Timeframe : Openning
Here is a more detailed summary of the historical variations registered by COVESTRO AGO.N.:
Near a new HIGH record (1 month)
Type : Bullish
Timeframe : Weekly
Technical
A technical analysis in Daily of this COVESTRO AGO.N. chart shows a bullish trend. 71.43% of the signals given by moving averages are bullish. The overall trend is reinforced by the strong bullish signals from short-term moving averages. The Central Indicators market scanner currently does not detect any result that concerns moving averages.
In fact, according to the parameters integrated into the Central Analyzer system, 10 technical indicators out of 18 analysed are currently bullish. Caution: the Central Indicators scanner currently detects an excess:
CCI indicator is overbought : over 100
Type : Neutral
Timeframe : Daily
RSI indicator: bearish divergence
Type : Bearish
Timeframe : Daily
Williams %R indicator is overbought : over -20
Type : Neutral
Timeframe : Daily
Pivot points : price is under support 1
Type : Neutral
Timeframe : Daily
Price is back over the pivot point
Type : Bullish
Timeframe : Weekly
An analysis of the price chart with the Central Patterns scanner (detector of chart patterns and resistances and supports) shows a result that can have an impact on the price change:
Near resistance of channel
Type : Bearish
Timeframe : Daily
The Central Candlesticks scanner which studies Japanese candlesticks did not detect anything.
| S3 | S2 | S1 | Price | R1 | R2 | R3 | |
|---|---|---|---|---|---|---|---|
| ProTrendLines | 25.48 | 39.23 | 41.88 | 44.34 | 44.91 | 46.43 | 49.02 |
| Change (%) | -42.53% | -11.52% | -5.55% | - | +1.29% | +4.71% | +10.55% |
| Change | -18.86 | -5.11 | -2.46 | - | +0.57 | +2.09 | +4.68 |
| Level | Minor | Major | Intermediate | - | Major | Intermediate | Minor |
Pivot points can also be used to set your price objectives. Here is the price situation in relation to pivot points:
| Pivot points | S3 | S2 | S1 | PP | R1 | R2 | R3 |
|---|---|---|---|---|---|---|---|
| Standard | 43.59 | 44.08 | 44.52 | 45.01 | 45.45 | 45.94 | 46.38 |
| Camarilla | 44.70 | 44.79 | 44.88 | 44.96 | 45.05 | 45.13 | 45.22 |
| Woodie | 43.57 | 44.07 | 44.50 | 45.00 | 45.43 | 45.93 | 46.36 |
| Fibonacci | 44.08 | 44.44 | 44.66 | 45.01 | 45.37 | 45.59 | 45.94 |
| Pivot points | S3 | S2 | S1 | PP | R1 | R2 | R3 |
|---|---|---|---|---|---|---|---|
| Standard | 41.41 | 42.42 | 43.69 | 44.70 | 45.97 | 46.98 | 48.25 |
| Camarilla | 44.33 | 44.54 | 44.75 | 44.96 | 45.17 | 45.38 | 45.59 |
| Woodie | 41.54 | 42.49 | 43.82 | 44.77 | 46.10 | 47.05 | 48.38 |
| Fibonacci | 42.42 | 43.29 | 43.83 | 44.70 | 45.57 | 46.11 | 46.98 |
| Pivot points | S3 | S2 | S1 | PP | R1 | R2 | R3 |
|---|---|---|---|---|---|---|---|
| Standard | 34.15 | 35.72 | 38.46 | 40.03 | 42.77 | 44.34 | 47.08 |
| Camarilla | 40.01 | 40.40 | 40.80 | 41.19 | 41.59 | 41.98 | 42.38 |
| Woodie | 34.73 | 36.01 | 39.04 | 40.32 | 43.35 | 44.63 | 47.66 |
| Fibonacci | 35.72 | 37.37 | 38.39 | 40.03 | 41.68 | 42.70 | 44.34 |
Numerical data
The following is the status of technical indicators and moving averages registered at the time this technical analysis was created:
| RSI (14): | 61.47 | |
| MACD (12,26,9): | 1.2200 | |
| Directional Movement: | 8.25 | |
| AROON (14): | 64.29 | |
| DEMA (21): | 44.42 | |
| Parabolic SAR (0,02-0,02-0,2): | 45.71 | |
| Elder Ray (13): | 0.45 | |
| Super Trend (3,10): | 41.19 | |
| Zig ZAG (10): | 44.34 | |
| VORTEX (21): | 1.1300 | |
| Stochastique (14,3,5): | 85.16 | |
| TEMA (21): | 45.46 | |
| Williams %R (14): | -26.05 | |
| Chande Momentum Oscillator (20): | 2.87 | |
| Repulse (5,40,3): | 1.0200 | |
| ROCnROLL: | 1 | |
| TRIX (15,9): | 0.3400 | |
| Courbe Coppock: | 20.47 |
| MA7: | 44.80 | |
| MA20: | 42.51 | |
| MA50: | 41.35 | |
| MA100: | 42.01 | |
| MAexp7: | 44.44 | |
| MAexp20: | 42.99 | |
| MAexp50: | 42.13 | |
| MAexp100: | 43.10 | |
| Price / MA7: | -1.03% | |
| Price / MA20: | +4.30% | |
| Price / MA50: | +7.23% | |
| Price / MA100: | +5.55% | |
| Price / MAexp7: | -0.23% | |
| Price / MAexp20: | +3.14% | |
| Price / MAexp50: | +5.25% | |
| Price / MAexp100: | +2.88% |
News
The latest news and videos published on COVESTRO AGO.N. at the time of the analysis were as follows:
- DGAP-Adhoc: Covestro AG: Guidance for FY 2018 adjusted
- DGAP-Adhoc: Covestro AG: Covestro decides on EUR 1.5 billion share buy-back program
- DGAP-Adhoc: Covestro AG: Resignation of the CFO
- DGAP-Adhoc: Covestro AG: CEO succession planning
- All targets reached or exceeded: Covestro achieves record year
About author

Online


Add a comment
Comments
0 comments on the analysis COVESTRO AGO.N. - Daily