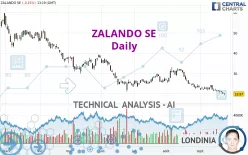
ZALANDO SE - Daily - Technical analysis published on 09/23/2022 (GMT)
- 215
- 0
Click here for a new analysis!
- Timeframe : Daily
- - Analysis generated on
- Status : TARGET REACHED

Summary of the analysis

Additional analysis
Quotes
The ZALANDO SE price is 19.970 EUR. The price registered a decrease of -0.15% on the session with the lowest point at 19.310 EUR and the highest point at 20.410 EUR. The deviation from the price is +3.42% for the low point and -2.16% for the high point.A bullish opening was detected by the Central Gaps scanner. Buyers are trying to impose a bullish momentum in the very short term.
Bullish opening
Type : Bullish
Timeframe : Openning
Here is a more detailed summary of the historical variations registered by ZALANDO SE:
New LOW record (5 years)
Type : Bearish
Timeframe : Weekly
New LOW record (1 year)
Type : Bearish
Timeframe : Weekly
New LOW record (1st january)
Type : Bearish
Timeframe : Weekly
New LOW record (1 month)
Type : Bearish
Timeframe : Weekly
Technical
A technical analysis in Daily of this ZALANDO SE chart shows a sharp bearish trend. 92.86% of the signals given by moving averages are bearish. The overall trend is supported by the strong bearish signals from short-term moving averages. The Central Indicators market scanner currently does not detect any result that concerns moving averages.
The probability of a further decline is moderate given the direction of the technical indicators.
Caution: the Central Indicators scanner currently detects an excess:
CCI indicator is oversold : under -100
Type : Neutral
Timeframe : Daily
Williams %R indicator is oversold : under -80
Type : Neutral
Timeframe : Daily
Pivot points : price is under support 1
Type : Neutral
Timeframe : Weekly
The Central Patterns scanner, which studies chart patterns, resistances and supports, has identified this signal:
Near horizontal resistance
Type : Bearish
Timeframe : Daily
The Central Candlesticks scanner, specialised in Japanese candlesticks, did not identify any signals.
| Price | R1 | R2 | R3 | |
|---|---|---|---|---|
| ProTrendLines | 19.970 | 29.548 | 47.188 | 64.320 |
| Change (%) | - | +47.96% | +136.29% | +222.08% |
| Change | - | +9.578 | +27.218 | +44.350 |
| Level | - | Intermediate | Intermediate | Intermediate |
Pivot points can also be used to set your price objectives. Here is the price situation in relation to pivot points:
| Pivot points | S3 | S2 | S1 | PP | R1 | R2 | R3 |
|---|---|---|---|---|---|---|---|
| Standard | 18.667 | 19.333 | 19.667 | 20.333 | 20.667 | 21.333 | 21.667 |
| Camarilla | 19.725 | 19.817 | 19.908 | 20.000 | 20.092 | 20.183 | 20.275 |
| Woodie | 18.500 | 19.250 | 19.500 | 20.250 | 20.500 | 21.250 | 21.500 |
| Fibonacci | 19.333 | 19.715 | 19.951 | 20.333 | 20.715 | 20.951 | 21.333 |
| Pivot points | S3 | S2 | S1 | PP | R1 | R2 | R3 |
|---|---|---|---|---|---|---|---|
| Standard | 16.810 | 18.870 | 20.270 | 22.330 | 23.730 | 25.790 | 27.190 |
| Camarilla | 20.719 | 21.036 | 21.353 | 21.670 | 21.987 | 22.304 | 22.622 |
| Woodie | 16.480 | 18.705 | 19.940 | 22.165 | 23.400 | 25.625 | 26.860 |
| Fibonacci | 18.870 | 20.192 | 21.008 | 22.330 | 23.652 | 24.468 | 25.790 |
| Pivot points | S3 | S2 | S1 | PP | R1 | R2 | R3 |
|---|---|---|---|---|---|---|---|
| Standard | 8.600 | 15.510 | 19.310 | 26.220 | 30.020 | 36.930 | 40.730 |
| Camarilla | 20.165 | 21.147 | 22.128 | 23.110 | 24.092 | 25.074 | 26.055 |
| Woodie | 7.045 | 14.733 | 17.755 | 25.443 | 28.465 | 36.153 | 39.175 |
| Fibonacci | 15.510 | 19.601 | 22.129 | 26.220 | 30.311 | 32.839 | 36.930 |
Numerical data
The following are the details of the technical indicators and moving averages that were collected to generate this technical analysis:
| RSI (14): | 31.25 | |
| MACD (12,26,9): | -1.4620 | |
| Directional Movement: | -21.846 | |
| AROON (14): | -64.286 | |
| DEMA (21): | 20.502 | |
| Parabolic SAR (0,02-0,02-0,2): | 23.314 | |
| Elder Ray (13): | -1.801 | |
| Super Trend (3,10): | 23.437 | |
| Zig ZAG (10): | 19.900 | |
| VORTEX (21): | 0.7730 | |
| Stochastique (14,3,5): | 11.63 | |
| TEMA (21): | 20.118 | |
| Williams %R (14): | -87.01 | |
| Chande Momentum Oscillator (20): | -2.770 | |
| Repulse (5,40,3): | -2.2090 | |
| ROCnROLL: | 2 | |
| TRIX (15,9): | -0.8270 | |
| Courbe Coppock: | 16.28 |
| MA7: | 21.086 | |
| MA20: | 22.217 | |
| MA50: | 25.718 | |
| MA100: | 28.027 | |
| MAexp7: | 20.961 | |
| MAexp20: | 22.427 | |
| MAexp50: | 24.994 | |
| MAexp100: | 29.927 | |
| Price / MA7: | -5.29% | |
| Price / MA20: | -10.11% | |
| Price / MA50: | -22.35% | |
| Price / MA100: | -28.75% | |
| Price / MAexp7: | -4.73% | |
| Price / MAexp20: | -10.96% | |
| Price / MAexp50: | -20.10% | |
| Price / MAexp100: | -33.27% |
News
Don't forget to follow the news on ZALANDO SE. At the time of publication of this analysis, the latest news was as follows:
- DGAP-News: Zalando SE: Zalando expects growth and improved profitability for the second half of 2022
- DGAP-Adhoc: Zalando SE: Zalando SE: Weaker Q2 2022 expected and revised outlook for the full year 2022
- DGAP-News: Zalando SE: Zalando deepens customer relationships in first quarter
- DGAP-News: Zalando on track with 2025 growth plan fueled by strong customer growth in 2021
- DGAP-Adhoc: Zalando SE: Zalando Launches Share Buy-back for Stock Option Programs
About author
Online


Add a comment
Comments
0 comments on the analysis ZALANDO SE - Daily