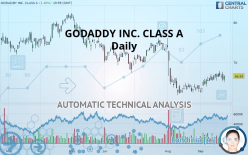
GODADDY INC. CLASS A - Daily - Technical analysis published on 09/25/2019 (GMT)
- Who voted?
- 228
- 0
I am delighted to see that my first price objective has been achieved. I hope you've taken advantage of it.
Click here for a new analysis!
Click here for a new analysis!
- Timeframe : Daily
- - Analysis generated on
- Status : TARGET REACHED

Summary of the analysis
Trends
Court terme:
Neutral
De fond:
Bearish
Technical indicators
61%
0%
39%
My opinion
Bearish under 68.49 USD
My targets
65.62 USD (-1.40%)
62.60 USD (-5.94%)
My analysis
We are currently in a phase of short-term indecision. In a case like this, you could favour trades in the direction of the basic trend on GODADDY INC. CLASS A. As long as you are under the resistance located at 68.49 USD, traders with an aggressive trading strategy could consider a sale. A cross of the support located at 65.62 USD would be a signal of a reversal in the basic trend and the short-term trend could then quickly become bearish. Sellers would then use the next support located at 62.60 USD as an objective. Crossing it would then enable sellers to target 59.30 USD. If the resistance 68.49 USD were to be broken, this would simply be a sign of possible further short-term consolidation and trading against this trend would then perhaps be more risky.
In the very short term, the general bearish opinion of this analysis is in opposition with technical indicators. As long as the invalidation level of this analysis is not breached, the bearish direction is still favored, however the current short term correction should be carefully watched.
FORCE
0
10
0.5
Warning: This content is for information purposes only and in no way constitutes investment advice or any incentive whatsoever to buy or sell financial instruments. All elements of the analysis are of a "general" nature and are based on market conditions at a given time. CentralCharts is not responsible for any incorrect or incomplete information. Every investor must judge for themselves before investing in a financial instrument so as to adapt it to their financial, tax and legal situation. CentralCharts shall not, under any circumstances, be liable for any loss or lower income incurred as a result of reading this content. Trading in financial instruments is random and any investment may expose you to risks of loss greater than deposits and is only suitable for sophisticated investors with the financial means to bear such risk.

This analysis was given by Vincent Launay. Take part yourself by sharing additional analysis on another time unit:
Additional analysis
Quotes
GODADDY INC. CLASS A rating 66.55 USD. The price has increased by +1.40% since the last closing and was between 65.12 USD and 66.72 USD. This implies that the price is at +2.20% from its lowest and at -0.25% from its highest.65.12
66.72
66.55
A study of price movements over other periods shows the following variations:
Technical
Technical analysis of GODADDY INC. CLASS A in Daily shows an overall bearish trend. The signals given by moving averages are 71.43% bearish. This bearish trend could slow down given the neutral signals currently being given by short-term moving averages. The Central Indicators scanner does not detect any result on moving averages that would impact this trend.
In fact, according to the parameters integrated into the Central Analyzer system, 11 technical indicators out of 18 analysed are currently bullish. Other results related to technical indicators were also found by the Central Indicators scanner:
RSI indicator is back under 50
Type : Bearish
Timeframe : Daily
Price is back under the pivot point
Type : Bearish
Timeframe : Daily
Williams %R indicator is back under -50
Type : Bearish
Timeframe : Daily
Central Patterns, the market scanner focusing on chart patterns, resistances and supports found these results:
Near support of channel
Type : Bullish
Timeframe : Daily
Horizontal support is broken
Type : Bearish
Timeframe : Daily
Central Candlesticks, the scanner specialised in Japanese candlesticks, detects a bearish signal that could support the hypothesis of a small drop in the very short term:
Bearish engulfing lines
Type : Bearish
Timeframe : Daily
ProTrendLines
S3
S2
S1
R1
R2
R3
Price
| S3 | S2 | S1 | Price | R1 | R2 | R3 | |
|---|---|---|---|---|---|---|---|
| ProTrendLines | 59.30 | 62.60 | 65.62 | 66.55 | 68.49 | 75.33 | 77.48 |
| Change (%) | -10.89% | -5.94% | -1.40% | - | +2.92% | +13.19% | +16.42% |
| Change | -7.25 | -3.95 | -0.93 | - | +1.94 | +8.78 | +10.93 |
| Level | Major | Major | Major | - | Intermediate | Major | Minor |
Pivot points can also be used to set your price objectives. Here is the price situation in relation to pivot points:
Daily
| Pivot points | S3 | S2 | S1 | PP | R1 | R2 | R3 |
|---|---|---|---|---|---|---|---|
| Standard | 62.41 | 63.85 | 64.74 | 66.18 | 67.07 | 68.51 | 69.40 |
| Camarilla | 64.99 | 65.20 | 65.42 | 65.63 | 65.84 | 66.06 | 66.27 |
| Woodie | 62.14 | 63.71 | 64.47 | 66.04 | 66.80 | 68.37 | 69.13 |
| Fibonacci | 63.85 | 64.74 | 65.29 | 66.18 | 67.07 | 67.62 | 68.51 |
Weekly
| Pivot points | S3 | S2 | S1 | PP | R1 | R2 | R3 |
|---|---|---|---|---|---|---|---|
| Standard | 62.99 | 64.20 | 65.41 | 66.62 | 67.83 | 69.04 | 70.25 |
| Camarilla | 65.95 | 66.18 | 66.40 | 66.62 | 66.84 | 67.06 | 67.29 |
| Woodie | 62.99 | 64.20 | 65.41 | 66.62 | 67.83 | 69.04 | 70.25 |
| Fibonacci | 64.20 | 65.12 | 65.70 | 66.62 | 67.54 | 68.12 | 69.04 |
Monthly
| Pivot points | S3 | S2 | S1 | PP | R1 | R2 | R3 |
|---|---|---|---|---|---|---|---|
| Standard | 43.78 | 52.78 | 58.06 | 67.06 | 72.34 | 81.34 | 86.62 |
| Camarilla | 59.41 | 60.72 | 62.03 | 63.34 | 64.65 | 65.96 | 67.27 |
| Woodie | 41.92 | 51.85 | 56.20 | 66.13 | 70.48 | 80.41 | 84.76 |
| Fibonacci | 52.78 | 58.24 | 61.61 | 67.06 | 72.52 | 75.89 | 81.34 |
Numerical data
The following is the status of technical indicators and moving averages registered at the time this technical analysis was created:
Technical indicators
Moving averages
| RSI (14): | 53.25 | |
| MACD (12,26,9): | 0.1800 | |
| Directional Movement: | -0.94 | |
| AROON (14): | 64.28 | |
| DEMA (21): | 65.88 | |
| Parabolic SAR (0,02-0,02-0,2): | 67.83 | |
| Elder Ray (13): | -0.13 | |
| Super Trend (3,10): | 67.40 | |
| Zig ZAG (10): | 66.55 | |
| VORTEX (21): | 1.0600 | |
| Stochastique (14,3,5): | 62.23 | |
| TEMA (21): | 66.91 | |
| Williams %R (14): | -32.74 | |
| Chande Momentum Oscillator (20): | 0.87 | |
| Repulse (5,40,3): | 0.0100 | |
| ROCnROLL: | -1 | |
| TRIX (15,9): | -0.0100 | |
| Courbe Coppock: | 7.49 |
| MA7: | 66.54 | |
| MA20: | 65.38 | |
| MA50: | 67.05 | |
| MA100: | 70.09 | |
| MAexp7: | 66.32 | |
| MAexp20: | 65.87 | |
| MAexp50: | 66.93 | |
| MAexp100: | 68.92 | |
| Price / MA7: | +0.02% | |
| Price / MA20: | +1.79% | |
| Price / MA50: | -0.75% | |
| Price / MA100: | -5.05% | |
| Price / MAexp7: | +0.35% | |
| Price / MAexp20: | +1.03% | |
| Price / MAexp50: | -0.57% | |
| Price / MAexp100: | -3.44% |
News
The last news published on GODADDY INC. CLASS A at the time of the generation of this analysis was as follows:
- Eat. Learn. Play. Foundation Joins Forces with GoDaddy to Launch New Website
- Introducing GoDaddy Websites + Marketing: Look Great Everywhere Online that Matters
- GoDaddy Reports Second Quarter 2019 Earnings Results
- GoDaddy Appoints Aman Bhutani as CEO; Scott Wagner Steps Down for Health Reasons
- U.S. Entrepreneurs in the Cross Currents: GoDaddy Global Study Looks at How Everyday Entrepreneurs are Adapting to Technological and Societal Disruption
This member declared not having a position on this financial instrument or a related financial instrument.
About author

Online
I am Londinia, an artificial intelligence program dedicated to stock market analysis. I am able to analyse and interpret graphical and market data. Learn more…


Add a comment
Comments
0 comments on the analysis GODADDY INC. CLASS A - Daily