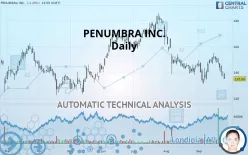
PENUMBRA INC. - Daily - Technical analysis published on 09/27/2019 (GMT)
- 277
- 0
- Who voted?
Click here for a new analysis!
- Timeframe : Daily
- - Analysis generated on
- Status : TARGET REACHED

Summary of the analysis

Additional analysis
Quotes
PENUMBRA INC. rating 135.08 USD. The price is lower by -3.49% since the last closing with the lowest point at 134.80 USD and the highest point at 139.12 USD. The deviation from the price is +0.21% for the low point and -2.90% for the high point.A bearish opening was detected by the Central Gaps scanner. Sellers are trying to impose a bearish trend in the very short term.
Bearish opening
Type : Bearish
Timeframe : Openning
Here is a more detailed summary of the historical variations registered by PENUMBRA INC.:
Near a new LOW record (1 month)
Type : Bearish
Timeframe : Weekly
Abnormal volumes on PENUMBRA INC. were detected by the Central Volumes scanner:
Abnormal volumes
Timeframe : 5 days
Abnormal volumes
Timeframe : 20 days
Technical
Technical analysis of PENUMBRA INC. in Daily shows a overall strongly bearish trend. 82.14% of the signals given by moving averages are bearish. The overall trend is supported by the strong bearish signals from short-term moving averages. The Central Indicators market scanner currently does not detect any result that concerns moving averages.
In fact, 11 technical indicators on 18 studied are currently bearish. Central Indicators, the scanner specialised in technical indicators, has identified these signals:
Pivot points : price is under support 3
Type : Neutral
Timeframe : Daily
Pivot points : price is under support 3
Type : Neutral
Timeframe : Weekly
The Central Patterns scanner, which studies chart patterns, resistances and supports, has identified this signal:
Support of channel is broken
Type : Bearish
Timeframe : Daily
No result was found by the Central Candlesticks scanner on Japanese candlesticks.
| S3 | S2 | S1 | Price | R1 | R2 | R3 | |
|---|---|---|---|---|---|---|---|
| ProTrendLines | 113.63 | 125.01 | 132.05 | 135.08 | 143.52 | 151.69 | 160.10 |
| Change (%) | -15.88% | -7.45% | -2.24% | - | +6.25% | +12.30% | +18.52% |
| Change | -21.45 | -10.07 | -3.03 | - | +8.44 | +16.61 | +25.02 |
| Level | Minor | Major | Major | - | Intermediate | Minor | Major |
Pivot points can also be used to set your price objectives. Here is the price situation in relation to pivot points:
| Pivot points | S3 | S2 | S1 | PP | R1 | R2 | R3 |
|---|---|---|---|---|---|---|---|
| Standard | 134.11 | 135.61 | 137.79 | 139.29 | 141.47 | 142.97 | 145.15 |
| Camarilla | 138.95 | 139.29 | 139.62 | 139.96 | 140.30 | 140.64 | 140.97 |
| Woodie | 134.44 | 135.78 | 138.12 | 139.46 | 141.80 | 143.14 | 145.48 |
| Fibonacci | 135.61 | 137.02 | 137.89 | 139.29 | 140.70 | 141.57 | 142.97 |
| Pivot points | S3 | S2 | S1 | PP | R1 | R2 | R3 |
|---|---|---|---|---|---|---|---|
| Standard | 135.43 | 140.75 | 144.33 | 149.65 | 153.23 | 158.55 | 162.13 |
| Camarilla | 145.45 | 146.27 | 147.08 | 147.90 | 148.72 | 149.53 | 150.35 |
| Woodie | 134.55 | 140.32 | 143.45 | 149.22 | 152.35 | 158.12 | 161.25 |
| Fibonacci | 140.75 | 144.15 | 146.25 | 149.65 | 153.05 | 155.15 | 158.55 |
| Pivot points | S3 | S2 | S1 | PP | R1 | R2 | R3 |
|---|---|---|---|---|---|---|---|
| Standard | 96.76 | 117.39 | 131.47 | 152.10 | 166.18 | 186.81 | 200.89 |
| Camarilla | 136.01 | 139.19 | 142.37 | 145.55 | 148.73 | 151.91 | 155.10 |
| Woodie | 93.49 | 115.75 | 128.20 | 150.46 | 162.91 | 185.17 | 197.62 |
| Fibonacci | 117.39 | 130.65 | 138.84 | 152.10 | 165.36 | 173.55 | 186.81 |
Numerical data
The following is the status of technical indicators and moving averages registered at the time this technical analysis was created:
| RSI (14): | 35.07 | |
| MACD (12,26,9): | -2.2200 | |
| Directional Movement: | -13.40 | |
| AROON (14): | 50.00 | |
| DEMA (21): | 141.26 | |
| Parabolic SAR (0,02-0,02-0,2): | 153.31 | |
| Elder Ray (13): | -6.38 | |
| Super Trend (3,10): | 153.50 | |
| Zig ZAG (10): | 135.08 | |
| VORTEX (21): | 0.9300 | |
| Stochastique (14,3,5): | 27.19 | |
| TEMA (21): | 142.08 | |
| Williams %R (14): | -92.99 | |
| Chande Momentum Oscillator (20): | -5.32 | |
| Repulse (5,40,3): | -5.4800 | |
| ROCnROLL: | 2 | |
| TRIX (15,9): | -0.1900 | |
| Courbe Coppock: | 4.83 |
| MA7: | 143.59 | |
| MA20: | 143.63 | |
| MA50: | 152.57 | |
| MA100: | 153.25 | |
| MAexp7: | 141.76 | |
| MAexp20: | 144.38 | |
| MAexp50: | 148.81 | |
| MAexp100: | 150.18 | |
| Price / MA7: | -5.93% | |
| Price / MA20: | -5.95% | |
| Price / MA50: | -11.46% | |
| Price / MA100: | -11.86% | |
| Price / MAexp7: | -4.71% | |
| Price / MAexp20: | -6.44% | |
| Price / MAexp50: | -9.23% | |
| Price / MAexp100: | -10.05% |
News
Don"t forget to follow the news on PENUMBRA INC.. At the time of publication of this analysis, the latest news was as follows:
- Sri Kosaraju Promoted to President and CFO of Penumbra
- Penumbra, Inc. to Present at the 2019 Wells Fargo Healthcare Conference
- Penumbra, Inc. Reports Second Quarter 2019 Financial Results
- Spruce Point Capital Management Releases A Strong Sell Research Opinion On Penumbra, Inc. (NYSE: PEN)
- Penumbra, Inc. to Present at the Canaccord Genuity 39th Annual Growth Conference
About author

Online


Add a comment
Comments
0 comments on the analysis PENUMBRA INC. - Daily