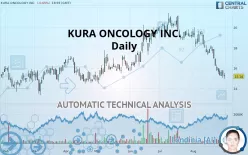
KURA ONCOLOGY INC. - Daily - Technical analysis published on 09/02/2019 (GMT)
- 165
- 0
Click here for a new analysis!
- Timeframe : Daily
- - Analysis generated on
- Status : INVALID

Summary of the analysis

Additional analysis
Quotes
The KURA ONCOLOGY INC. price is 15.18 USD. The price registered a decrease of -0.65% on the session with the lowest point at 14.93 USD and the highest point at 15.52 USD. The deviation from the price is +1.67% for the low point and -2.19% for the high point.A bullish opening was detected by the Central Gaps scanner. Buyers are trying to impose a bullish momentum in the very short term.
Bullish opening
Type : Bullish
Timeframe : Openning
A study of price movements over other periods shows the following variations:
Technical
Technical analysis of KURA ONCOLOGY INC. in Daily shows a overall strongly bearish trend. The signals given by moving averages are 85.71% bearish. This strong bearish trend is confirmed by the strong signals currently being given by short-term moving averages. The Central Indicators market scanner currently does not detect any result that concerns moving averages.
The probability of a further decline is moderate given the direction of the technical indicators.
Caution: the Central Indicators scanner currently detects an excess:
RSI indicator is oversold : under 30
Type : Neutral
Timeframe : Daily
CCI indicator is oversold : under -100
Type : Neutral
Timeframe : Daily
Williams %R indicator is oversold : under -80
Type : Neutral
Timeframe : Daily
Price is back under the pivot point
Type : Bearish
Timeframe : Daily
Price is back under the pivot point
Type : Bearish
Timeframe : Weekly
Central Patterns, the scanner specializing in chart patterns, did not identify any signals.
No result was found by the Central Candlesticks scanner on Japanese candlesticks.
| S3 | S2 | S1 | Price | R1 | R2 | R3 | |
|---|---|---|---|---|---|---|---|
| ProTrendLines | 12.57 | 13.73 | 14.74 | 15.18 | 15.71 | 16.84 | 19.60 |
| Change (%) | -17.19% | -9.55% | -2.90% | - | +3.49% | +10.94% | +29.12% |
| Change | -2.61 | -1.45 | -0.44 | - | +0.53 | +1.66 | +4.42 |
| Level | Minor | Intermediate | Major | - | Intermediate | Intermediate | Major |
Attention could also be paid to pivot points to set price objectives:
| Pivot points | S3 | S2 | S1 | PP | R1 | R2 | R3 |
|---|---|---|---|---|---|---|---|
| Standard | 14.20 | 14.61 | 14.95 | 15.36 | 15.70 | 16.11 | 16.45 |
| Camarilla | 15.07 | 15.14 | 15.21 | 15.28 | 15.35 | 15.42 | 15.49 |
| Woodie | 14.16 | 14.59 | 14.91 | 15.34 | 15.66 | 16.09 | 16.41 |
| Fibonacci | 14.61 | 14.90 | 15.08 | 15.36 | 15.65 | 15.83 | 16.11 |
| Pivot points | S3 | S2 | S1 | PP | R1 | R2 | R3 |
|---|---|---|---|---|---|---|---|
| Standard | 12.39 | 14.05 | 14.93 | 16.59 | 17.47 | 19.13 | 20.01 |
| Camarilla | 15.11 | 15.34 | 15.58 | 15.81 | 16.04 | 16.28 | 16.51 |
| Woodie | 12.00 | 13.86 | 14.54 | 16.40 | 17.08 | 18.94 | 19.62 |
| Fibonacci | 14.05 | 15.02 | 15.62 | 16.59 | 17.56 | 18.16 | 19.13 |
| Pivot points | S3 | S2 | S1 | PP | R1 | R2 | R3 |
|---|---|---|---|---|---|---|---|
| Standard | 15.44 | 17.09 | 18.11 | 19.76 | 20.78 | 22.43 | 23.45 |
| Camarilla | 18.39 | 18.63 | 18.88 | 19.12 | 19.37 | 19.61 | 19.85 |
| Woodie | 15.12 | 16.93 | 17.79 | 19.60 | 20.46 | 22.27 | 23.13 |
| Fibonacci | 17.09 | 18.11 | 18.74 | 19.76 | 20.78 | 21.41 | 22.43 |
Numerical data
The following is the status of the technical indicators and moving averages at the time of publication of this technical analysis:
| RSI (14): | 26.91 | |
| MACD (12,26,9): | -1.0100 | |
| Directional Movement: | -24.05 | |
| AROON (14): | -100.00 | |
| DEMA (21): | 15.76 | |
| Parabolic SAR (0,02-0,02-0,2): | 16.46 | |
| Elder Ray (13): | -1.17 | |
| Super Trend (3,10): | 17.27 | |
| Zig ZAG (10): | 15.18 | |
| VORTEX (21): | 0.7000 | |
| Stochastique (14,3,5): | 7.18 | |
| TEMA (21): | 15.01 | |
| Williams %R (14): | -93.40 | |
| Chande Momentum Oscillator (20): | -2.40 | |
| Repulse (5,40,3): | -5.1700 | |
| ROCnROLL: | 2 | |
| TRIX (15,9): | -0.6100 | |
| Courbe Coppock: | 32.04 |
| MA7: | 15.58 | |
| MA20: | 17.32 | |
| MA50: | 18.76 | |
| MA100: | 17.51 | |
| MAexp7: | 15.73 | |
| MAexp20: | 16.96 | |
| MAexp50: | 17.79 | |
| MAexp100: | 17.54 | |
| Price / MA7: | -2.57% | |
| Price / MA20: | -12.36% | |
| Price / MA50: | -19.08% | |
| Price / MA100: | -13.31% | |
| Price / MAexp7: | -3.50% | |
| Price / MAexp20: | -10.50% | |
| Price / MAexp50: | -14.67% | |
| Price / MAexp100: | -13.45% |
News
The last news published on KURA ONCOLOGY INC. at the time of the generation of this analysis was as follows:
- Investor Network: Kura Oncology, Inc. to Host Earnings Call
- Kura Oncology Doses First Patient in Phase 2 Study of Tipifarnib in Chronic Myelomonocytic Leukemia
- Kura Oncology Receives FDA Clearance to Proceed with Clinical Trial for ERK Inhibitor KO-947 and Nominates KO-539 as Development Candidate for Menin-MLL Inhibitor Program
- Kura Oncology Appoints Steven Stein, M.D. to Board of Directors
- Kura Oncology Presents Preclinical Data on KO-947 and Menin-MLL Inhibitor Program at the EORTC-NCI-AACR Symposium on Molecular Targets and Cancer Therapeutics
About author

Online


Add a comment
Comments
0 comments on the analysis KURA ONCOLOGY INC. - Daily