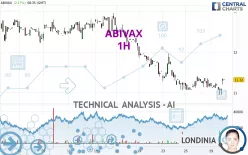
ABIVAX - 1H - Technical analysis published on 07/30/2024 (GMT)
- 363
- 0
Click here for a new analysis!
- Timeframe : 1H
- - Analysis generated on
- Status : TARGET REACHED

Summary of the analysis

Additional analysis
Quotes
The ABIVAX rating is 11.34 EUR. The price has increased by +2.35% since the last closing with the lowest point at 10.94 EUR and the highest point at 11.36 EUR. The deviation from the price is +3.66% for the low point and -0.18% for the high point.A bearish opening was detected by the Central Gaps scanner. Sellers are trying to impose a bearish trend in the very short term.
Bearish opening
Type : Bearish
Timeframe : Openning
Here is a more detailed summary of the historical variations registered by ABIVAX:
New LOW record (1 month)
Type : Bearish
Timeframe : Weekly
Technical
Technical analysis of this 1H chart of ABIVAX indicates that the overall trend is bearish. The signals given by moving averages are 67.86% bearish. This bearish trend could slow down given the neutral signals currently being given by short-term moving averages. The Central Indicators scanner detects bullish signals on moving averages that could impact this trend:
Bullish trend reversal : Moving Average 20
Type : Bullish
Timeframe : 1 hour
Bullish price crossover with Moving Average 20
Type : Bullish
Timeframe : 1 hour
Bullish price crossover with adaptative moving average 50
Type : Bullish
Timeframe : 1 hour
The probability of a further increase are moderate given the direction of the technical indicators.
Caution: the Central Indicators scanner currently detects an excess:
Williams %R indicator is overbought : over -20
Type : Neutral
Timeframe : 1 hour
Pivot points : price is over resistance 1
Type : Neutral
Timeframe : 1 hour
RSI indicator is back over 50
Type : Bullish
Timeframe : 1 hour
Parabolic SAR indicator bullish reversal
Type : Bullish
Timeframe : 1 hour
Momentum indicator is back over 0
Type : Bullish
Timeframe : 1 hour
Central Patterns, the market scanner focusing on chart patterns, resistances and supports found this result:
Near horizontal support
Type : Bullish
Timeframe : 1 hour
The presence of a bullish Japanese candlestick pattern detected by Central Candlesticks that could cause a very short term rebound was also detected:
Upside gap
Type : Bullish
Timeframe : 1 hour
| S3 | S2 | S1 | Price | R1 | R2 | R3 | |
|---|---|---|---|---|---|---|---|
| ProTrendLines | 8.89 | 10.36 | 11.06 | 11.34 | 11.68 | 11.96 | 12.40 |
| Change (%) | -21.60% | -8.64% | -2.47% | - | +3.00% | +5.47% | +9.35% |
| Change | -2.45 | -0.98 | -0.28 | - | +0.34 | +0.62 | +1.06 |
| Level | Intermediate | Intermediate | Major | - | Major | Minor | Major |
To determine price objectives, it is also possible to use the pivot points. Here is the price position in relation to pivot points:
| Pivot points | S3 | S2 | S1 | PP | R1 | R2 | R3 |
|---|---|---|---|---|---|---|---|
| Standard | 10.63 | 10.79 | 10.93 | 11.09 | 11.23 | 11.39 | 11.53 |
| Camarilla | 11.00 | 11.03 | 11.05 | 11.08 | 11.11 | 11.14 | 11.16 |
| Woodie | 10.63 | 10.79 | 10.93 | 11.09 | 11.23 | 11.39 | 11.53 |
| Fibonacci | 10.79 | 10.90 | 10.97 | 11.09 | 11.20 | 11.27 | 11.39 |
| Pivot points | S3 | S2 | S1 | PP | R1 | R2 | R3 |
|---|---|---|---|---|---|---|---|
| Standard | 9.97 | 10.51 | 10.87 | 11.41 | 11.77 | 12.31 | 12.67 |
| Camarilla | 10.97 | 11.06 | 11.14 | 11.22 | 11.30 | 11.39 | 11.47 |
| Woodie | 9.87 | 10.47 | 10.77 | 11.37 | 11.67 | 12.27 | 12.57 |
| Fibonacci | 10.51 | 10.86 | 11.07 | 11.41 | 11.76 | 11.97 | 12.31 |
| Pivot points | S3 | S2 | S1 | PP | R1 | R2 | R3 |
|---|---|---|---|---|---|---|---|
| Standard | 8.95 | 10.25 | 10.97 | 12.27 | 12.99 | 14.29 | 15.01 |
| Camarilla | 11.13 | 11.31 | 11.50 | 11.68 | 11.87 | 12.05 | 12.24 |
| Woodie | 8.65 | 10.11 | 10.67 | 12.13 | 12.69 | 14.15 | 14.71 |
| Fibonacci | 10.25 | 11.03 | 11.50 | 12.27 | 13.05 | 13.52 | 14.29 |
Numerical data
The following is the status of the technical indicators and moving averages at the time of publication of this technical analysis:
| RSI (14): | 55.74 | |
| MACD (12,26,9): | -0.0500 | |
| Directional Movement: | 4.30 | |
| AROON (14): | -71.42 | |
| DEMA (21): | 11.13 | |
| Parabolic SAR (0,02-0,02-0,2): | 10.94 | |
| Elder Ray (13): | 0.09 | |
| Super Trend (3,10): | 11.37 | |
| Zig ZAG (10): | 11.34 | |
| VORTEX (21): | 0.9700 | |
| Stochastique (14,3,5): | 55.56 | |
| TEMA (21): | 11.18 | |
| Williams %R (14): | -4.76 | |
| Chande Momentum Oscillator (20): | 0.06 | |
| Repulse (5,40,3): | 1.8900 | |
| ROCnROLL: | -1 | |
| TRIX (15,9): | -0.0800 | |
| Courbe Coppock: | 1.54 |
| MA7: | 11.30 | |
| MA20: | 12.06 | |
| MA50: | 12.40 | |
| MA100: | 13.02 | |
| MAexp7: | 11.18 | |
| MAexp20: | 11.21 | |
| MAexp50: | 11.41 | |
| MAexp100: | 11.73 | |
| Price / MA7: | +0.35% | |
| Price / MA20: | -5.97% | |
| Price / MA50: | -8.55% | |
| Price / MA100: | -12.90% | |
| Price / MAexp7: | +1.43% | |
| Price / MAexp20: | +1.16% | |
| Price / MAexp50: | -0.61% | |
| Price / MAexp100: | -3.32% |
News
The latest news and videos published on ABIVAX at the time of the analysis were as follows:
- EQS-News: Abivax Provides Operational and Key Program Update
- Abivax Provides Operational and Key Program Update
- Abivax releases the results of its May 30, 2024 Ordinary and Extraordinary General Meeting
- Abivax announces presentation of four abstracts for obefazimod in ulcerative colitis and preclinical colon cancer model at Digestive Disease Week 2024
- Abivax annual ordinary and extraordinary general meeting of May 30, 2024 - Availability of the preparatory documents
About author
Online


Add a comment
Comments
0 comments on the analysis ABIVAX - 1H