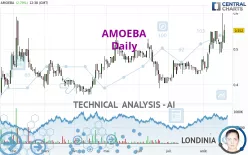
AMOEBA - Daily - Technical analysis published on 08/21/2024 (GMT)
- 101
- 0
Oops, I was wrong about that analysis. My threshold for invalidation has been broken.
Click here for a new analysis!
Click here for a new analysis!
- Timeframe : Daily
- - Analysis generated on
- Status : INVALID

Summary of the analysis
Trends
Short term:
Strongly bullish
Underlying:
Strongly bullish
Technical indicators
72%
0%
28%
My opinion
Bullish above 0.5150 EUR
My targets
0.6127 EUR (+10.99%)
1.2660 EUR (+129.35%)
My analysis
AMOEBA is part of a very strong bullish trend. Traders may consider trading only long positions (at the time of purchase) as long as the price remains well above 0.5150 EUR. The next resistance located at 0.6127 EUR is the next bullish objective to be reached. A bullish break in this resistance would boost the bullish momentum. The bullish movement could then continue towards the next resistance located at 1.2660 EUR. After this resistance, buyers could then target 2.3750 EUR. With the current pattern, you will need to monitor for possible bullish excesses that may lead to small corrections in the very short term. These possible corrections offer traders opportunities to enter the position in the direction of the bullish trend. Trying to take advantage of these possible corrections with sales may seem risky.
In the very short term, the general bullish sentiment is confirmed by technical indicators. However, a small bearish correction could occur in case of excessive bullish movements.
Force
0
10
8.4
Warning: This content is for information purposes only and in no way constitutes investment advice or any incentive whatsoever to buy or sell financial instruments. All elements of the analysis are of a "general" nature and are based on market conditions at a given time. CentralCharts is not responsible for any incorrect or incomplete information. Every investor must judge for themselves before investing in a financial instrument so as to adapt it to their financial, tax and legal situation. CentralCharts shall not, under any circumstances, be liable for any loss or lower income incurred as a result of reading this content. Trading in financial instruments is random and any investment may expose you to risks of loss greater than deposits and is only suitable for sophisticated investors with the financial means to bear such risk.

This analysis was given by pierrott. Take part yourself by sharing additional analysis on another time unit:
Additional analysis
Quotes
The AMOEBA rating is 0.5520 EUR. On the day, this instrument gained +2.79% with the lowest point at 0.5170 EUR and the highest point at 0.5680 EUR. The deviation from the price is +6.77% for the low point and -2.82% for the high point.0.5170
0.5680
0.5520
A bearish opening was detected by the Central Gaps scanner. Sellers are trying to impose a bearish trend in the very short term.
Bearish opening
Type : Bearish
Timeframe : Openning
Here is a more detailed summary of the historical variations registered by AMOEBA:
Technical
Technical analysis of AMOEBA in Daily shows a strongly overall bullish trend. 92.86% of the signals given by moving averages are bullish. This strongly bullish trend is supported by the strong bullish signals given by short-term moving averages. There is no crossing of moving average by the price or crossing of moving averages between themselves.
The probability of a further increase is high given the direction of the technical indicators.
Other results related to technical indicators were also found by the Central Indicators scanner:
Pivot points : price is over resistance 1
Type : Neutral
Timeframe : Weekly
Price is back over the pivot point
Type : Bullish
Timeframe : Daily
The Central Patterns scanner, which studies chart patterns, resistances and supports, has identified these signals:
Horizontal resistance is broken
Type : Bullish
Timeframe : Daily
Resistance of channel is broken
Type : Bullish
Timeframe : Daily
No result was found by the Central Candlesticks scanner on Japanese candlesticks.
ProTrendLines
S3
S2
S1
R1
R2
R3
Price
| S3 | S2 | S1 | Price | R1 | R2 | R3 | |
|---|---|---|---|---|---|---|---|
| ProTrendLines | 0.4560 | 0.5150 | 0.5500 | 0.5520 | 1.2660 | 2.3750 | 4.5944 |
| Change (%) | -17.39% | -6.70% | -0.36% | - | +129.35% | +330.25% | +732.32% |
| Change | -0.0960 | -0.0370 | -0.0020 | - | +0.7140 | +1.8230 | +4.0424 |
| Level | Major | Intermediate | Intermediate | - | Major | Minor | Intermediate |
To determine price objectives, it is also possible to use the pivot points. Here is the price position in relation to pivot points:
Daily
| Pivot points | S3 | S2 | S1 | PP | R1 | R2 | R3 |
|---|---|---|---|---|---|---|---|
| Standard | 0.3930 | 0.4470 | 0.4920 | 0.5460 | 0.5910 | 0.6450 | 0.6900 |
| Camarilla | 0.5098 | 0.5189 | 0.5279 | 0.5370 | 0.5461 | 0.5552 | 0.5642 |
| Woodie | 0.3885 | 0.4448 | 0.4875 | 0.5438 | 0.5865 | 0.6428 | 0.6855 |
| Fibonacci | 0.4470 | 0.4848 | 0.5082 | 0.5460 | 0.5838 | 0.6072 | 0.6450 |
Weekly
| Pivot points | S3 | S2 | S1 | PP | R1 | R2 | R3 |
|---|---|---|---|---|---|---|---|
| Standard | 0.4237 | 0.4553 | 0.4867 | 0.5183 | 0.5497 | 0.5813 | 0.6127 |
| Camarilla | 0.5007 | 0.5065 | 0.5122 | 0.5180 | 0.5238 | 0.5296 | 0.5353 |
| Woodie | 0.4235 | 0.4553 | 0.4865 | 0.5183 | 0.5495 | 0.5813 | 0.6125 |
| Fibonacci | 0.4553 | 0.4794 | 0.4943 | 0.5183 | 0.5424 | 0.5573 | 0.5813 |
Monthly
| Pivot points | S3 | S2 | S1 | PP | R1 | R2 | R3 |
|---|---|---|---|---|---|---|---|
| Standard | 0.3700 | 0.3900 | 0.4300 | 0.4500 | 0.4900 | 0.5100 | 0.5500 |
| Camarilla | 0.4535 | 0.4590 | 0.4645 | 0.4700 | 0.4755 | 0.4810 | 0.4865 |
| Woodie | 0.3800 | 0.3950 | 0.4400 | 0.4550 | 0.5000 | 0.5150 | 0.5600 |
| Fibonacci | 0.3900 | 0.4129 | 0.4271 | 0.4500 | 0.4729 | 0.4871 | 0.5100 |
Numerical data
The following is the status of the technical indicators and moving averages at the time of publication of this technical analysis:
Technical indicators
Moving averages
| RSI (14): | 66.21 | |
| MACD (12,26,9): | 0.0227 | |
| Directional Movement: | 23.3629 | |
| AROON (14): | 78.5714 | |
| DEMA (21): | 0.5331 | |
| Parabolic SAR (0,02-0,02-0,2): | 0.4900 | |
| Elder Ray (13): | 0.0245 | |
| Super Trend (3,10): | 0.4535 | |
| Zig ZAG (10): | 0.5520 | |
| VORTEX (21): | 1.1120 | |
| Stochastique (14,3,5): | 68.67 | |
| TEMA (21): | 0.5477 | |
| Williams %R (14): | -29.27 | |
| Chande Momentum Oscillator (20): | 0.1040 | |
| Repulse (5,40,3): | 11.1771 | |
| ROCnROLL: | 1 | |
| TRIX (15,9): | 0.5972 | |
| Courbe Coppock: | 34.85 |
| MA7: | 0.5326 | |
| MA20: | 0.4951 | |
| MA50: | 0.4644 | |
| MA100: | 0.4601 | |
| MAexp7: | 0.5311 | |
| MAexp20: | 0.5054 | |
| MAexp50: | 0.4802 | |
| MAexp100: | 0.4665 | |
| Price / MA7: | +3.64% | |
| Price / MA20: | +11.49% | |
| Price / MA50: | +18.86% | |
| Price / MA100: | +19.97% | |
| Price / MAexp7: | +3.94% | |
| Price / MAexp20: | +9.22% | |
| Price / MAexp50: | +14.95% | |
| Price / MAexp100: | +18.33% |
Quotes :
-
15 min delayed data
-
Euronext Paris
News
Don't forget to follow the news on AMOEBA. At the time of publication of this analysis, the latest news was as follows:
- Edison issues report on Amoéba (ALMIB)
-
 Amoeba – executive interview
-
Florida man contracts brain-eating amoeba through tap water
-
Nevada Boy Dies From Rare Brain-Eating Amoeba
-
Young Girl Dies After Contracting Rare Brain-Eating Amoeba | NBC Nightly News
This member declared not having a position on this financial instrument or a related financial instrument.
About author

Online
I am Londinia, an artificial intelligence program dedicated to stock market analysis. I am able to analyse and interpret graphical and market data. Learn more…


Add a comment
Comments
0 comments on the analysis AMOEBA - Daily