| Open: | - |
| Change: | - |
| Volume: | - |
| Low: | - |
| High: | - |
| High / Low range: | - |
| Type: | Commodities |
| Ticker: | XAUGBP |
| ISIN: |
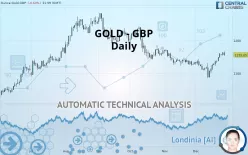
GOLD - GBP - Daily - Technical analysis published on 12/28/2019 (GMT)
- 341
- 0
- 12/28/2019 - 22:41
- Who voted?
Click here for a new analysis!
- Timeframe : Daily
- - Analysis generated on 12/28/2019 - 22:41
- Status : TARGET REACHED

Summary of the analysis
Additional analysis
Quotes
The GOLD - GBP rating is 1,155.05 GBP. The price registered a decrease of -0.64% on the session with the lowest point at 1,151.94 GBP and the highest point at 1,165.71 GBP. The deviation from the price is +0.27% for the low point and -0.91% for the high point.A bearish opening was detected by the Central Gaps scanner. Sellers are trying to impose a bearish trend in the very short term.
Bearish opening
Type : Bearish
Timeframe : Openning
Here is a more detailed summary of the historical variations registered by GOLD - GBP:
Technical
Technical analysis of GOLD - GBP in Daily shows a neutral overall trend. The trend could quickly turn bullish due to the strong bullish signals currently being given by short-term moving averages. There is no crossing of moving average by the price or crossing of moving averages between themselves.
Technical indicators are strongly bullish, suggesting that the price increase should continue.
Caution: the Central Indicators scanner currently detects an excess:
CCI indicator is overbought : over 100
Type : Neutral
Timeframe : Daily
Williams %R indicator is overbought : over -20
Type : Neutral
Timeframe : Daily
Pivot points : price is over resistance 1
Type : Neutral
Timeframe : Weekly
Pivot points : price is under support 1
Type : Neutral
Timeframe : Daily
Ichimoku - Bullish crossover : Tenkan & Kijun
Type : Bullish
Timeframe : Daily
Price is back over the pivot point
Type : Bullish
Timeframe : Daily
The analysis of the price chart with Central Patterns scanners does not return any result.
Central Candlesticks, the scanner specialised in Japanese candlesticks, detects a bullish signal that could support the hypothesis of a small rebound in the very short term:
Three white soldiers
Type : Bullish
Timeframe : Daily
| S3 | S2 | S1 | Price | R1 | R2 | R3 | |
|---|---|---|---|---|---|---|---|
| ProTrendLines | 1,057.49 | 1,087.46 | 1,134.58 | 1,155.05 | 1,181.22 | 1,238.04 | 1,281.36 |
| Change (%) | -8.45% | -5.85% | -1.77% | - | +2.27% | +7.18% | +10.94% |
| Change | -97.56 | -67.59 | -20.47 | - | +26.17 | +82.99 | +126.31 |
| Level | Major | Intermediate | Major | - | Major | Intermediate | Major |
To determine price objectives, it is also possible to use the pivot points. Here is the price position in relation to pivot points:
| Pivot points | S3 | S2 | S1 | PP | R1 | R2 | R3 |
|---|---|---|---|---|---|---|---|
| Standard | 1,144.44 | 1,148.86 | 1,155.65 | 1,160.07 | 1,166.86 | 1,171.28 | 1,178.07 |
| Camarilla | 1,159.35 | 1,160.38 | 1,161.40 | 1,162.43 | 1,163.46 | 1,164.49 | 1,165.51 |
| Woodie | 1,145.62 | 1,149.45 | 1,156.83 | 1,160.66 | 1,168.04 | 1,171.87 | 1,179.25 |
| Fibonacci | 1,148.86 | 1,153.15 | 1,155.79 | 1,160.07 | 1,164.36 | 1,167.00 | 1,171.28 |
| Pivot points | S3 | S2 | S1 | PP | R1 | R2 | R3 |
|---|---|---|---|---|---|---|---|
| Standard | 1,073.66 | 1,087.03 | 1,111.92 | 1,125.29 | 1,150.18 | 1,163.55 | 1,188.44 |
| Camarilla | 1,126.30 | 1,129.81 | 1,133.31 | 1,136.82 | 1,140.33 | 1,143.83 | 1,147.34 |
| Woodie | 1,079.43 | 1,089.91 | 1,117.69 | 1,128.17 | 1,155.95 | 1,166.43 | 1,194.21 |
| Fibonacci | 1,087.03 | 1,101.64 | 1,110.67 | 1,125.29 | 1,139.90 | 1,148.93 | 1,163.55 |
| Pivot points | S3 | S2 | S1 | PP | R1 | R2 | R3 |
|---|---|---|---|---|---|---|---|
| Standard | 1,062.37 | 1,092.68 | 1,112.25 | 1,142.56 | 1,162.13 | 1,192.44 | 1,212.01 |
| Camarilla | 1,118.09 | 1,122.67 | 1,127.24 | 1,131.81 | 1,136.38 | 1,140.96 | 1,145.53 |
| Woodie | 1,056.99 | 1,090.00 | 1,106.87 | 1,139.88 | 1,156.75 | 1,189.76 | 1,206.63 |
| Fibonacci | 1,092.68 | 1,111.74 | 1,123.51 | 1,142.56 | 1,161.62 | 1,173.39 | 1,192.44 |
Numerical data
The following is the status of technical indicators and moving averages registered at the time this technical analysis was created:
| RSI (14): | 59.67 | |
| MACD (12,26,9): | 3.7200 | |
| Directional Movement: | 9.86 | |
| AROON (14): | 71.43 | |
| DEMA (21): | 1,136.86 | |
| Parabolic SAR (0,02-0,02-0,2): | 1,115.42 | |
| Elder Ray (13): | 20.11 | |
| Super Trend (3,10): | 1,118.29 | |
| Zig ZAG (10): | 1,155.05 | |
| VORTEX (21): | 1.1000 | |
| Stochastique (14,3,5): | 93.96 | |
| TEMA (21): | 1,148.95 | |
| Williams %R (14): | -13.25 | |
| Chande Momentum Oscillator (20): | 40.00 | |
| Repulse (5,40,3): | 0.8900 | |
| ROCnROLL: | 1 | |
| TRIX (15,9): | -0.0400 | |
| Courbe Coppock: | 4.25 |
| MA7: | 1,146.41 | |
| MA20: | 1,127.83 | |
| MA50: | 1,139.58 | |
| MA100: | 1,181.63 | |
| MAexp7: | 1,146.97 | |
| MAexp20: | 1,135.68 | |
| MAexp50: | 1,143.99 | |
| MAexp100: | 1,148.42 | |
| Price / MA7: | +0.75% | |
| Price / MA20: | +2.41% | |
| Price / MA50: | +1.36% | |
| Price / MA100: | -2.25% | |
| Price / MAexp7: | +0.70% | |
| Price / MAexp20: | +1.71% | |
| Price / MAexp50: | +0.97% | |
| Price / MAexp100: | +0.58% |
About author

Online


Add a comment
Comments
0 comments on the analysis GOLD - GBP - Daily