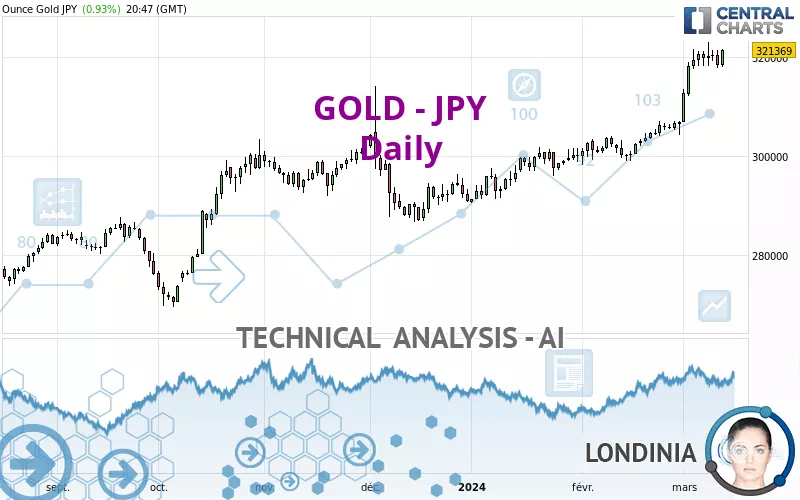
GOLD - JPY - Daily - Technical analysis published on 03/13/2024 (GMT)
- 169
- 0
- Timeframe : Daily
- - Analysis generated on
- Status : WITHOUT TARGET
Summary of the analysis
Additional analysis
Quotes
The GOLD - JPY rating is 321,369 JPY. The price registered an increase of +0.93% on the session and was between 317,837 JPY and 321,576 JPY. This implies that the price is at +1.11% from its lowest and at -0.06% from its highest.A bearish opening was detected by the Central Gaps scanner. Sellers are trying to impose a bearish trend in the very short term.
Bearish opening
Type : Bearish
Timeframe : Openning
Here is a more detailed summary of the historical variations registered by GOLD - JPY:
Near a new HIGH record (5 years)
Type : Bullish
Timeframe : Weekly
Near a new HIGH record (1 year)
Type : Bullish
Timeframe : Weekly
Near a new HIGH record (1st january)
Type : Bullish
Timeframe : Weekly
Near a new HIGH record (1 month)
Type : Bullish
Timeframe : Weekly
Abnormal volumes on GOLD - JPY were detected by the Central Volumes scanner:
Abnormal volumes
Timeframe : 5 days
Abnormal volumes
Timeframe : 20 days
Abnormal volumes
Timeframe : 50 days
Technical
Technical analysis of this Daily chart of GOLD - JPY indicates that the overall trend is strongly bullish. The signals given by the moving averages are 92.86% bullish. This strong bullish trend is confirmed by the strong signals currently being given by short-term moving averages. The Central Indicators market scanner currently does not detect any result that concerns moving averages.
An assessment of technical indicators shows a strong bullish signal.
But beware of excesses. The Central Indicators scanner currently detects this:
RSI indicator is overbought : over 70
Type : Neutral
Timeframe : Daily
Williams %R indicator is overbought : over -20
Type : Neutral
Timeframe : Daily
Pivot points : price is over resistance 1
Type : Neutral
Timeframe : Daily
No signals are given by Central Patterns, a market scanner specialised in chart patterns, resistances and supports.
Central Candlesticks, the scanner specialised in Japanese candlesticks, detects a bullish signal that could support the hypothesis of a small rebound in the very short term:
Bullish engulfing lines
Type : Bullish
Timeframe : Daily
| S3 | S2 | S1 | Price | |
|---|---|---|---|---|
| ProTrendLines | 300,364 | 304,130 | 320,518 | 321,369 |
| Change (%) | -6.54% | -5.36% | -0.26% | - |
| Change | -21,005 | -17,239 | -851 | - |
| Level | Intermediate | Intermediate | Major | - |
To determine price objectives, it is also possible to use the pivot points. Here is the price position in relation to pivot points:
| Pivot points | S3 | S2 | S1 | PP | R1 | R2 | R3 |
|---|---|---|---|---|---|---|---|
| Standard | 313,208 | 315,441 | 316,923 | 319,156 | 320,638 | 322,871 | 324,353 |
| Camarilla | 317,383 | 317,724 | 318,064 | 318,405 | 318,746 | 319,086 | 319,427 |
| Woodie | 312,833 | 315,253 | 316,548 | 318,968 | 320,263 | 322,683 | 323,978 |
| Fibonacci | 315,441 | 316,860 | 317,737 | 319,156 | 320,575 | 321,452 | 322,871 |
| Pivot points | S3 | S2 | S1 | PP | R1 | R2 | R3 |
|---|---|---|---|---|---|---|---|
| Standard | 302,974 | 307,557 | 313,814 | 318,397 | 324,654 | 329,237 | 335,494 |
| Camarilla | 317,089 | 318,083 | 319,076 | 320,070 | 321,064 | 322,057 | 323,051 |
| Woodie | 303,810 | 307,976 | 314,650 | 318,816 | 325,490 | 329,656 | 336,330 |
| Fibonacci | 307,557 | 311,698 | 314,256 | 318,397 | 322,538 | 325,096 | 329,237 |
| Pivot points | S3 | S2 | S1 | PP | R1 | R2 | R3 |
|---|---|---|---|---|---|---|---|
| Standard | 291,821 | 294,949 | 300,869 | 303,997 | 309,917 | 313,045 | 318,965 |
| Camarilla | 304,300 | 305,129 | 305,959 | 306,788 | 307,617 | 308,447 | 309,276 |
| Woodie | 293,216 | 295,647 | 302,264 | 304,695 | 311,312 | 313,743 | 320,360 |
| Fibonacci | 294,949 | 298,406 | 300,541 | 303,997 | 307,454 | 309,589 | 313,045 |
Numerical data
The following is the status of the technical indicators and moving averages at the time of publication of this technical analysis:
| RSI (14): | 78.00 | |
| MACD (12,26,9): | 5,291.0000 | |
| Directional Movement: | 26 | |
| AROON (14): | 72 | |
| DEMA (21): | 319,411 | |
| Parabolic SAR (0,02-0,02-0,2): | 317,090 | |
| Elder Ray (13): | 3,947 | |
| Super Trend (3,10): | 310,778 | |
| Zig ZAG (10): | 321,414 | |
| VORTEX (21): | 1.0000 | |
| Stochastique (14,3,5): | 85.00 | |
| TEMA (21): | 322,012 | |
| Williams %R (14): | -9.00 | |
| Chande Momentum Oscillator (20): | 15,498 | |
| Repulse (5,40,3): | 1.0000 | |
| ROCnROLL: | 1 | |
| TRIX (15,9): | 0.0000 | |
| Courbe Coppock: | 10.00 |
| MA7: | 319,974 | |
| MA20: | 311,023 | |
| MA50: | 303,836 | |
| MA100: | 299,655 | |
| MAexp7: | 318,768 | |
| MAexp20: | 312,876 | |
| MAexp50: | 305,876 | |
| MAexp100: | 299,620 | |
| Price / MA7: | +0.44% | |
| Price / MA20: | +3.33% | |
| Price / MA50: | +5.77% | |
| Price / MA100: | +7.25% | |
| Price / MAexp7: | +0.82% | |
| Price / MAexp20: | +2.71% | |
| Price / MAexp50: | +5.07% | |
| Price / MAexp100: | +7.26% |
News
The latest news and videos published on GOLD - JPY at the time of the analysis were as follows:
About author

Online


Add a comment
Comments
0 comments on the analysis GOLD - JPY - Daily