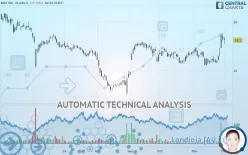
BOX INC. CLASS A - Daily - Technical analysis published on 12/03/2019 (GMT)
- 157
- 0
Click here for a new analysis!
- Timeframe : Daily
- - Analysis generated on
- Status : INVALID

Summary of the analysis

Additional analysis
Quotes
BOX INC. CLASS A rating 18.10 USD. On the day, this instrument lost -0.71% with the lowest point at 17.73 USD and the highest point at 18.43 USD. The deviation from the price is +2.09% for the low point and -1.79% for the high point.A bearish opening was detected by the Central Gaps scanner. Sellers are trying to impose a bearish trend in the very short term.
Bearish opening
Type : Bearish
Timeframe : Openning
Here is a more detailed summary of the historical variations registered by BOX INC. CLASS A:
Near a new HIGH record (1 month)
Type : Bullish
Timeframe : Weekly
Technical
A technical analysis in Daily of this BOX INC. CLASS A chart shows a strongly bullish trend. 85.71% of the signals given by moving averages are bullish. The overall trend is supported by the strong bullish signals from short-term moving averages. The Central Indicators scanner does not detect any result on moving averages that would impact this trend.
In fact, 17 technical indicators on 18 studied are currently bullish. But beware of excesses. The Central Indicators scanner currently detects this:
CCI indicator is overbought : over 100
Type : Neutral
Timeframe : Daily
Previous candle closed over Bollinger bands
Type : Neutral
Timeframe : Daily
Williams %R indicator is overbought : over -20
Type : Neutral
Timeframe : Daily
Price is back over the pivot point
Type : Bullish
Timeframe : Weekly
Price is back under the pivot point
Type : Bearish
Timeframe : Daily
Central Patterns, the market scanner focusing on chart patterns, resistances and supports found this result:
Resistance of channel is broken
Type : Bullish
Timeframe : Daily
For a small setback in the very short term, the Central Candlesticks scanner currently notes the presence of this bearish pattern in Japanese candlesticks:
Bearish harami
Type : Bearish
Timeframe : Daily
| S3 | S2 | S1 | Price | R1 | R2 | R3 | |
|---|---|---|---|---|---|---|---|
| ProTrendLines | 13.03 | 16.21 | 17.88 | 18.10 | 18.82 | 20.80 | 23.90 |
| Change (%) | -28.01% | -10.44% | -1.22% | - | +3.98% | +14.92% | +32.04% |
| Change | -5.07 | -1.89 | -0.22 | - | +0.72 | +2.70 | +5.80 |
| Level | Intermediate | Major | Major | - | Major | Minor | Intermediate |
Pivot points can also be used to set your price objectives. Here is the price situation in relation to pivot points:
| Pivot points | S3 | S2 | S1 | PP | R1 | R2 | R3 |
|---|---|---|---|---|---|---|---|
| Standard | 17.15 | 17.58 | 17.91 | 18.34 | 18.67 | 19.10 | 19.43 |
| Camarilla | 18.02 | 18.09 | 18.16 | 18.23 | 18.30 | 18.37 | 18.44 |
| Woodie | 17.09 | 17.56 | 17.85 | 18.32 | 18.61 | 19.08 | 19.37 |
| Fibonacci | 17.58 | 17.87 | 18.05 | 18.34 | 18.63 | 18.81 | 19.10 |
| Pivot points | S3 | S2 | S1 | PP | R1 | R2 | R3 |
|---|---|---|---|---|---|---|---|
| Standard | 13.85 | 14.96 | 16.59 | 17.70 | 19.33 | 20.44 | 22.07 |
| Camarilla | 17.48 | 17.73 | 17.98 | 18.23 | 18.48 | 18.73 | 18.98 |
| Woodie | 14.12 | 15.09 | 16.86 | 17.83 | 19.60 | 20.57 | 22.34 |
| Fibonacci | 14.96 | 16.00 | 16.65 | 17.70 | 18.74 | 19.39 | 20.44 |
| Pivot points | S3 | S2 | S1 | PP | R1 | R2 | R3 |
|---|---|---|---|---|---|---|---|
| Standard | 12.89 | 14.18 | 16.21 | 17.50 | 19.53 | 20.82 | 22.85 |
| Camarilla | 17.32 | 17.62 | 17.93 | 18.23 | 18.53 | 18.84 | 19.14 |
| Woodie | 13.25 | 14.37 | 16.57 | 17.69 | 19.89 | 21.01 | 23.21 |
| Fibonacci | 14.18 | 15.45 | 16.24 | 17.50 | 18.77 | 19.56 | 20.82 |
Numerical data
The following is the status of the technical indicators and moving averages at the time of publication of this technical analysis:
| RSI (14): | 64.55 | |
| MACD (12,26,9): | 0.3200 | |
| Directional Movement: | 19.72 | |
| AROON (14): | 71.42 | |
| DEMA (21): | 17.12 | |
| Parabolic SAR (0,02-0,02-0,2): | 15.77 | |
| Elder Ray (13): | 1.07 | |
| Super Trend (3,10): | 16.35 | |
| Zig ZAG (10): | 18.10 | |
| VORTEX (21): | 1.0400 | |
| Stochastique (14,3,5): | 85.44 | |
| TEMA (21): | 17.43 | |
| Williams %R (14): | -21.08 | |
| Chande Momentum Oscillator (20): | 1.92 | |
| Repulse (5,40,3): | 2.3200 | |
| ROCnROLL: | 1 | |
| TRIX (15,9): | 0.0300 | |
| Courbe Coppock: | 9.64 |
| MA7: | 17.14 | |
| MA20: | 16.58 | |
| MA50: | 16.60 | |
| MA100: | 16.17 | |
| MAexp7: | 17.43 | |
| MAexp20: | 16.81 | |
| MAexp50: | 16.59 | |
| MAexp100: | 16.73 | |
| Price / MA7: | +5.60% | |
| Price / MA20: | +9.17% | |
| Price / MA50: | +9.04% | |
| Price / MA100: | +11.94% | |
| Price / MAexp7: | +3.84% | |
| Price / MAexp20: | +7.67% | |
| Price / MAexp50: | +9.10% | |
| Price / MAexp100: | +8.19% |
News
The latest news and videos published on BOX INC. CLASS A at the time of the analysis were as follows:
About author

Online


Add a comment
Comments
0 comments on the analysis BOX INC. CLASS A - Daily