EURONAV - Daily - Technical analysis published on 07/23/2024 (GMT)
- 85
- 0
Click here for a new analysis!
- Timeframe : Daily
- - Analysis generated on
- Status : TARGET REACHED
Summary of the analysis

Additional analysis
Quotes
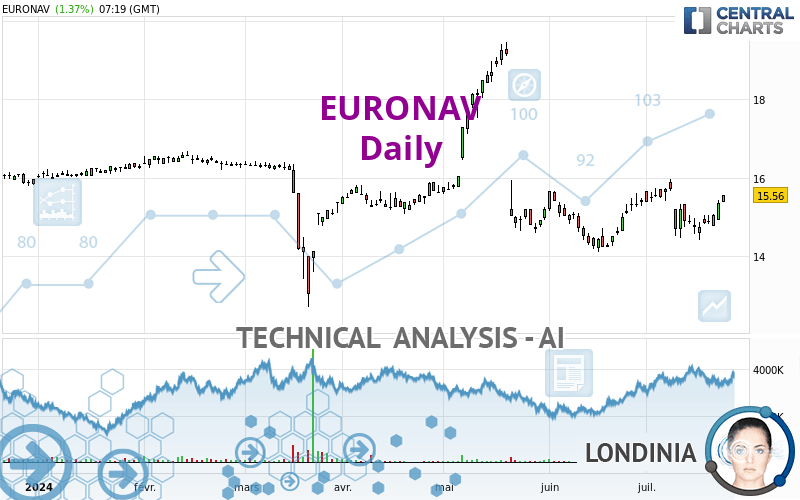
The EURONAV rating is 15.56 EUR. On the day, this instrument gained +1.37% and was traded between 15.38 EUR and 15.56 EUR over the period. The price is currently at +1.17% from its lowest and 0% from its highest.The Central Gaps scanner detects a bullish opening. A small advantage for buyers in the very short term.
Bullish opening
Type : Bullish
Timeframe : Openning
A study of price movements over other periods shows the following variations:
New HIGH record (5 years)
Type : Bullish
Timeframe : Weekly
New HIGH record (1 year)
Type : Bullish
Timeframe : Weekly
New HIGH record (1st january)
Type : Bullish
Timeframe : Weekly
New HIGH record (1 month)
Type : Bullish
Timeframe : Weekly
Technical
A technical analysis in Daily of this EURONAV chart shows a strongly bullish trend. 92.86% of the signals given by moving averages are bullish. The overall trend is supported by the strong bullish signals from short-term moving averages. The Central Indicators market scanner currently does not detect any result that concerns moving averages.
In fact, according to the parameters integrated into the Central Analyzer system, 17 technical indicators out of 18 analysed are currently bullish. But beware of excesses. The Central Indicators scanner currently detects this:
RSI indicator is overbought : over 70
Type : Neutral
Timeframe : Daily
CCI indicator is overbought : over 100
Type : Neutral
Timeframe : Daily
Williams %R indicator is overbought : over -20
Type : Neutral
Timeframe : Daily
Pivot points : price is over resistance 1
Type : Neutral
Timeframe : Daily
Pivot points : price is over resistance 1
Type : Neutral
Timeframe : Weekly
Central Patterns, the market scanner focusing on chart patterns, resistances and supports found these results:
Near resistance of channel
Type : Bearish
Timeframe : Daily
Near horizontal support
Type : Bullish
Timeframe : Daily
For a small setback in the very short term, the Central Candlesticks scanner currently notes the presence of this bearish pattern in Japanese candlesticks:
Bearish doji star
Type : Bearish
Timeframe : Daily
| S3 | S2 | S1 | Price | |
|---|---|---|---|---|
| ProTrendLines | 12.03 | 13.27 | 14.60 | 15.56 |
| Change (%) | -22.69% | -14.72% | -6.17% | - |
| Change | -3.53 | -2.29 | -0.96 | - |
| Level | Major | Minor | Major | - |
Pivot points can also be used to set your price objectives. Here is the price situation in relation to pivot points:
| Pivot points | S3 | S2 | S1 | PP | R1 | R2 | R3 |
|---|---|---|---|---|---|---|---|
| Standard | 14.53 | 14.73 | 15.04 | 15.24 | 15.55 | 15.75 | 16.06 |
| Camarilla | 15.21 | 15.26 | 15.30 | 15.35 | 15.40 | 15.44 | 15.49 |
| Woodie | 14.59 | 14.76 | 15.10 | 15.27 | 15.61 | 15.78 | 16.12 |
| Fibonacci | 14.73 | 14.93 | 15.05 | 15.24 | 15.44 | 15.56 | 15.75 |
| Pivot points | S3 | S2 | S1 | PP | R1 | R2 | R3 |
|---|---|---|---|---|---|---|---|
| Standard | 13.94 | 14.18 | 14.61 | 14.85 | 15.28 | 15.52 | 15.95 |
| Camarilla | 14.87 | 14.93 | 14.99 | 15.05 | 15.11 | 15.17 | 15.23 |
| Woodie | 14.05 | 14.23 | 14.72 | 14.90 | 15.39 | 15.57 | 16.06 |
| Fibonacci | 14.18 | 14.43 | 14.59 | 14.85 | 15.10 | 15.26 | 15.52 |
| Pivot points | S3 | S2 | S1 | PP | R1 | R2 | R3 |
|---|---|---|---|---|---|---|---|
| Standard | 12.01 | 12.58 | 13.46 | 14.03 | 14.91 | 15.48 | 16.36 |
| Camarilla | 13.93 | 14.06 | 14.20 | 14.33 | 14.46 | 14.60 | 14.73 |
| Woodie | 12.16 | 12.66 | 13.61 | 14.11 | 15.06 | 15.56 | 16.51 |
| Fibonacci | 12.58 | 13.14 | 13.48 | 14.03 | 14.59 | 14.93 | 15.48 |
Numerical data
The following is the status of technical indicators and moving averages registered at the time this technical analysis was created:
| RSI (14): | 74.24 | |
| MACD (12,26,9): | 0.3600 | |
| Directional Movement: | 16.33 | |
| AROON (14): | 85.71 | |
| DEMA (21): | 15.19 | |
| Parabolic SAR (0,02-0,02-0,2): | 14.43 | |
| Elder Ray (13): | 0.50 | |
| Super Trend (3,10): | 14.37 | |
| Zig ZAG (10): | 15.50 | |
| VORTEX (21): | 1.2000 | |
| Stochastique (14,3,5): | 87.46 | |
| TEMA (21): | 15.26 | |
| Williams %R (14): | 0.00 | |
| Chande Momentum Oscillator (20): | 0.92 | |
| Repulse (5,40,3): | 3.8200 | |
| ROCnROLL: | 1 | |
| TRIX (15,9): | 0.3300 | |
| Courbe Coppock: | 9.53 |
| MA7: | 15.01 | |
| MA20: | 14.73 | |
| MA50: | 14.19 | |
| MA100: | 12.82 | |
| MAexp7: | 15.11 | |
| MAexp20: | 14.73 | |
| MAexp50: | 14.06 | |
| MAexp100: | 13.32 | |
| Price / MA7: | +3.66% | |
| Price / MA20: | +5.63% | |
| Price / MA50: | +9.65% | |
| Price / MA100: | +21.37% | |
| Price / MAexp7: | +2.98% | |
| Price / MAexp20: | +5.63% | |
| Price / MAexp50: | +10.67% | |
| Price / MAexp100: | +16.82% |
News
The latest news and videos published on EURONAV at the time of the analysis were as follows:
- EURN Stock Alert: Halper Sadeh LLP Is Investigating Whether the Sale of Euronav NV Is Fair to Shareholders
- International Seaways Monetizes FSO Joint Venture With Sale to Euronav and Increases Quarterly Cash Dividend
- Euronav announces fourth quarter 2019 results
- Euronav announces second quarter and first half 2019 results
- Euronav announces second quarter and half year results 2018
About author
Online


Add a comment
Comments
0 comments on the analysis EURONAV - Daily