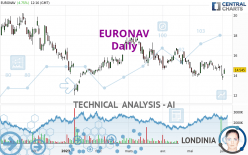
EURONAV - Daily - Technical analysis published on 06/02/2023 (GMT)
- 137
- 0
Click here for a new analysis!
- Timeframe : Daily
- - Analysis generated on
- Status : TARGET REACHED

Summary of the analysis

Additional analysis
Quotes
EURONAV rating 14.545 EUR. The price has increased by +4.75% since the last closing and was traded between 14.140 EUR and 14.720 EUR over the period. The price is currently at +2.86% from its lowest and -1.19% from its highest.A bullish opening was detected by the Central Gaps scanner. Buyers are trying to impose a bullish momentum in the very short term.
Bullish opening
Type : Bullish
Timeframe : Openning
Here is a more detailed summary of the historical variations registered by EURONAV:
New HIGH record (1 month)
Type : Bullish
Timeframe : Weekly
Technical
Technical analysis of this Daily chart of EURONAV indicates that the overall trend is bullish. 64.29% of the signals given by moving averages are bullish. The overall trend is reinforced by the strong bullish signals from short-term moving averages. An assessment of moving averages reveals several bullish signals that could impact this trend:
Bullish price crossover with Moving Average 50
Type : Bullish
Timeframe : Daily
Bullish price crossover with Moving Average 100
Type : Bullish
Timeframe : Daily
Bullish price crossover with adaptative moving average 20
Type : Bullish
Timeframe : Daily
Bullish price crossover with adaptative moving average 50
Type : Bullish
Timeframe : Daily
In fact, 12 technical indicators on 18 studied are currently positioned bullish. But beware of excesses. The Central Indicators scanner currently detects this:
CCI indicator is overbought : over 100
Type : Neutral
Timeframe : Daily
Williams %R indicator is overbought : over -20
Type : Neutral
Timeframe : Daily
Pivot points : price is over resistance 1
Type : Neutral
Timeframe : Weekly
Pivot points : price is over resistance 2
Type : Neutral
Timeframe : Daily
RSI indicator is back over 50
Type : Bullish
Timeframe : Daily
Parabolic SAR indicator bullish reversal
Type : Bullish
Timeframe : Daily
Aroon indicator bullish trend
Type : Bullish
Timeframe : Daily
Ichimoku - Bullish crossover : Tenkan & Kijun
Type : Bullish
Timeframe : Daily
Momentum indicator is back over 0
Type : Bullish
Timeframe : Daily
An analysis of the price chart with the Central Patterns scanner (detector of chart patterns and resistances and supports) shows several results that can have an impact on the price change:
Near horizontal resistance
Type : Bearish
Timeframe : Daily
Resistance of channel is broken
Type : Bullish
Timeframe : Daily
Resistance of triangle is broken
Type : Bullish
Timeframe : Daily
No result was found by the Central Candlesticks scanner on Japanese candlesticks.
| S3 | S2 | S1 | Price | R1 | R2 | R3 | |
|---|---|---|---|---|---|---|---|
| ProTrendLines | 11.581 | 13.514 | 14.534 | 14.545 | 15.530 | 16.498 | 18.192 |
| Change (%) | -20.38% | -7.09% | -0.08% | - | +6.77% | +13.43% | +25.07% |
| Change | -2.964 | -1.031 | -0.011 | - | +0.985 | +1.953 | +3.647 |
| Level | Major | Major | Major | - | Intermediate | Major | Intermediate |
Pivot points can also be used to set your price objectives. Here is the price situation in relation to pivot points:
| Pivot points | S3 | S2 | S1 | PP | R1 | R2 | R3 |
|---|---|---|---|---|---|---|---|
| Standard | 12.947 | 13.238 | 13.562 | 13.853 | 14.177 | 14.468 | 14.792 |
| Camarilla | 13.716 | 13.772 | 13.829 | 13.885 | 13.941 | 13.998 | 14.054 |
| Woodie | 12.963 | 13.246 | 13.578 | 13.861 | 14.193 | 14.476 | 14.808 |
| Fibonacci | 13.238 | 13.473 | 13.618 | 13.853 | 14.088 | 14.233 | 14.468 |
| Pivot points | S3 | S2 | S1 | PP | R1 | R2 | R3 |
|---|---|---|---|---|---|---|---|
| Standard | 12.236 | 12.841 | 13.241 | 13.846 | 14.246 | 14.851 | 15.251 |
| Camarilla | 13.365 | 13.457 | 13.549 | 13.641 | 13.733 | 13.825 | 13.917 |
| Woodie | 12.134 | 12.790 | 13.139 | 13.795 | 14.144 | 14.800 | 15.149 |
| Fibonacci | 12.841 | 13.225 | 13.462 | 13.846 | 14.230 | 14.467 | 14.851 |
| Pivot points | S3 | S2 | S1 | PP | R1 | R2 | R3 |
|---|---|---|---|---|---|---|---|
| Standard | 11.365 | 12.115 | 12.952 | 13.702 | 14.539 | 15.289 | 16.126 |
| Camarilla | 13.354 | 13.499 | 13.645 | 13.790 | 13.936 | 14.081 | 14.226 |
| Woodie | 11.410 | 12.137 | 12.997 | 13.724 | 14.584 | 15.311 | 16.171 |
| Fibonacci | 12.115 | 12.721 | 13.095 | 13.702 | 14.308 | 14.682 | 15.289 |
Numerical data
The following are the details of the technical indicators and moving averages that were collected to generate this technical analysis:
| RSI (14): | 58.06 | |
| MACD (12,26,9): | -0.0460 | |
| Directional Movement: | -0.213 | |
| AROON (14): | 14.286 | |
| DEMA (21): | 13.867 | |
| Parabolic SAR (0,02-0,02-0,2): | 12.962 | |
| Elder Ray (13): | 0.476 | |
| Super Trend (3,10): | 12.711 | |
| Zig ZAG (10): | 14.570 | |
| VORTEX (21): | 1.0150 | |
| Stochastique (14,3,5): | 69.23 | |
| TEMA (21): | 13.962 | |
| Williams %R (14): | -9.95 | |
| Chande Momentum Oscillator (20): | 0.313 | |
| Repulse (5,40,3): | 4.4600 | |
| ROCnROLL: | 1 | |
| TRIX (15,9): | -0.1190 | |
| Courbe Coppock: | 2.15 |
| MA7: | 13.854 | |
| MA20: | 13.870 | |
| MA50: | 14.192 | |
| MA100: | 14.296 | |
| MAexp7: | 13.999 | |
| MAexp20: | 13.964 | |
| MAexp50: | 14.174 | |
| MAexp100: | 14.386 | |
| Price / MA7: | +4.99% | |
| Price / MA20: | +4.87% | |
| Price / MA50: | +2.49% | |
| Price / MA100: | +1.74% | |
| Price / MAexp7: | +3.90% | |
| Price / MAexp20: | +4.16% | |
| Price / MAexp50: | +2.62% | |
| Price / MAexp100: | +1.11% |
News
The last news published on EURONAV at the time of the generation of this analysis was as follows:
- EURN Stock Alert: Halper Sadeh LLP Is Investigating Whether the Sale of Euronav NV Is Fair to Shareholders
- International Seaways Monetizes FSO Joint Venture With Sale to Euronav and Increases Quarterly Cash Dividend
- Euronav announces fourth quarter 2019 results
- Euronav announces second quarter and first half 2019 results
- Euronav announces second quarter and half year results 2018
About author
Online


Add a comment
Comments
0 comments on the analysis EURONAV - Daily