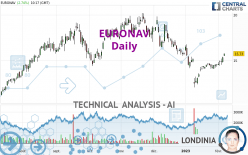
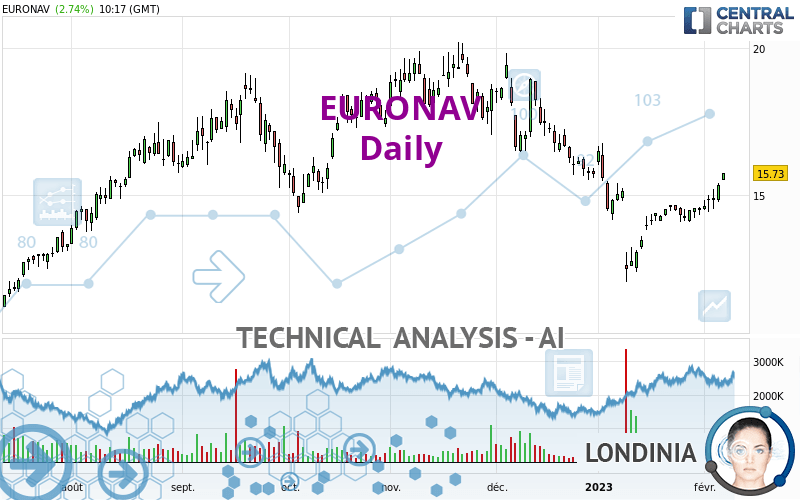
EURONAV - Daily - Technical analysis published on 02/07/2023 (GMT)
- 116
- 0
- Timeframe : Daily
- - Analysis generated on
- Status : NEUTRAL
Summary of the analysis

Additional analysis
Quotes
EURONAV rating 15.73 EUR. On the day, this instrument gained +2.74% with the lowest point at 15.50 EUR and the highest point at 15.74 EUR. The deviation from the price is +1.48% for the low point and -0.06% for the high point.The Central Gaps scanner detects the formation of a bullish gap marking the strong presence of buyers against sellers at the opening. This formed a quotation gap.
Opening Gap UP
Type : Bullish
Timeframe : Openning
So that you have an overall view of the price change, here is a table showing the variations over several periods:
New HIGH record (1 month)
Type : Bullish
Timeframe : Weekly
Technical
Technical analysis of EURONAV in Daily shows an overall slightly bearish trend. 60.71% of the signals given by moving averages are bearish. Caution: the slightly bullish signals currently given by short-term moving averages could cause a reversal of the trend. The Central Indicators market scanner is currently detecting a bullish signal that could impact this trend:
Bullish price crossover with adaptative moving average 50
Type : Bullish
Timeframe : Daily
The probability of a further increase is high given the direction of the technical indicators.
Caution: the Central Indicators scanner currently detects an excess:
CCI indicator is overbought : over 100
Type : Neutral
Timeframe : Daily
Williams %R indicator is overbought : over -20
Type : Neutral
Timeframe : Daily
Pivot points : price is over resistance 1
Type : Neutral
Timeframe : Daily
Pivot points : price is over resistance 1
Type : Neutral
Timeframe : Weekly
SuperTrend indicator bullish reversal
Type : Bullish
Timeframe : Daily
Central Patterns, the market scanner focusing on chart patterns, resistances and supports found these results:
Near horizontal resistance
Type : Bearish
Timeframe : Daily
Resistance of channel is broken
Type : Bullish
Timeframe : Daily
The presence of a bullish Japanese candlestick pattern detected by Central Candlesticks that could cause a very short term rebound was also detected:
Upside gap
Type : Bullish
Timeframe : Daily
| S3 | S2 | S1 | Price | R1 | R2 | R3 | |
|---|---|---|---|---|---|---|---|
| ProTrendLines | 12.72 | 14.55 | 15.65 | 15.73 | 17.60 | 18.58 | 20.30 |
| Change (%) | -19.14% | -7.50% | -0.51% | - | +11.89% | +18.12% | +29.05% |
| Change | -3.01 | -1.18 | -0.08 | - | +1.87 | +2.85 | +4.57 |
| Level | Intermediate | Major | Intermediate | - | Minor | Intermediate | Major |
Attention could also be paid to pivot points to set price objectives:
| Pivot points | S3 | S2 | S1 | PP | R1 | R2 | R3 |
|---|---|---|---|---|---|---|---|
| Standard | 14.28 | 14.52 | 14.91 | 15.15 | 15.54 | 15.78 | 16.17 |
| Camarilla | 15.14 | 15.20 | 15.25 | 15.31 | 15.37 | 15.43 | 15.48 |
| Woodie | 14.37 | 14.56 | 15.00 | 15.19 | 15.63 | 15.82 | 16.26 |
| Fibonacci | 14.52 | 14.76 | 14.91 | 15.15 | 15.39 | 15.54 | 15.78 |
| Pivot points | S3 | S2 | S1 | PP | R1 | R2 | R3 |
|---|---|---|---|---|---|---|---|
| Standard | 13.33 | 13.76 | 14.32 | 14.75 | 15.31 | 15.74 | 16.30 |
| Camarilla | 14.60 | 14.69 | 14.78 | 14.87 | 14.96 | 15.05 | 15.14 |
| Woodie | 13.39 | 13.79 | 14.38 | 14.78 | 15.37 | 15.77 | 16.36 |
| Fibonacci | 13.76 | 14.14 | 14.38 | 14.75 | 15.13 | 15.37 | 15.74 |
| Pivot points | S3 | S2 | S1 | PP | R1 | R2 | R3 |
|---|---|---|---|---|---|---|---|
| Standard | 7.33 | 9.67 | 12.07 | 14.41 | 16.81 | 19.15 | 21.55 |
| Camarilla | 13.17 | 13.60 | 14.04 | 14.47 | 14.91 | 15.34 | 15.77 |
| Woodie | 7.36 | 9.69 | 12.10 | 14.43 | 16.84 | 19.17 | 21.58 |
| Fibonacci | 9.67 | 11.48 | 12.60 | 14.41 | 16.22 | 17.34 | 19.15 |
Numerical data
The following is the status of technical indicators and moving averages registered at the time this technical analysis was created:
| RSI (14): | 60.00 | |
| MACD (12,26,9): | -0.0800 | |
| Directional Movement: | 5.18 | |
| AROON (14): | 64.29 | |
| DEMA (21): | 14.52 | |
| Parabolic SAR (0,02-0,02-0,2): | 14.38 | |
| Elder Ray (13): | 0.80 | |
| Super Trend (3,10): | 14.05 | |
| Zig ZAG (10): | 15.71 | |
| VORTEX (21): | 1.1000 | |
| Stochastique (14,3,5): | 89.30 | |
| TEMA (21): | 15.00 | |
| Williams %R (14): | -0.60 | |
| Chande Momentum Oscillator (20): | 1.22 | |
| Repulse (5,40,3): | 5.5900 | |
| ROCnROLL: | 1 | |
| TRIX (15,9): | -0.3600 | |
| Courbe Coppock: | 14.56 |
| MA7: | 14.91 | |
| MA20: | 14.34 | |
| MA50: | 15.76 | |
| MA100: | 16.72 | |
| MAexp7: | 15.03 | |
| MAexp20: | 14.80 | |
| MAexp50: | 15.48 | |
| MAexp100: | 15.77 | |
| Price / MA7: | +5.50% | |
| Price / MA20: | +9.69% | |
| Price / MA50: | -0.19% | |
| Price / MA100: | -5.92% | |
| Price / MAexp7: | +4.66% | |
| Price / MAexp20: | +6.28% | |
| Price / MAexp50: | +1.61% | |
| Price / MAexp100: | -0.25% |
News
The latest news and videos published on EURONAV at the time of the analysis were as follows:
- EURN Stock Alert: Halper Sadeh LLP Is Investigating Whether the Sale of Euronav NV Is Fair to Shareholders
- International Seaways Monetizes FSO Joint Venture With Sale to Euronav and Increases Quarterly Cash Dividend
- Euronav announces fourth quarter 2019 results
- Euronav announces second quarter and first half 2019 results
- Euronav announces second quarter and half year results 2018
About author
Online


Add a comment
Comments
0 comments on the analysis EURONAV - Daily