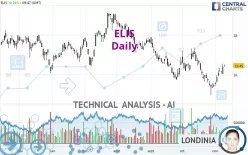
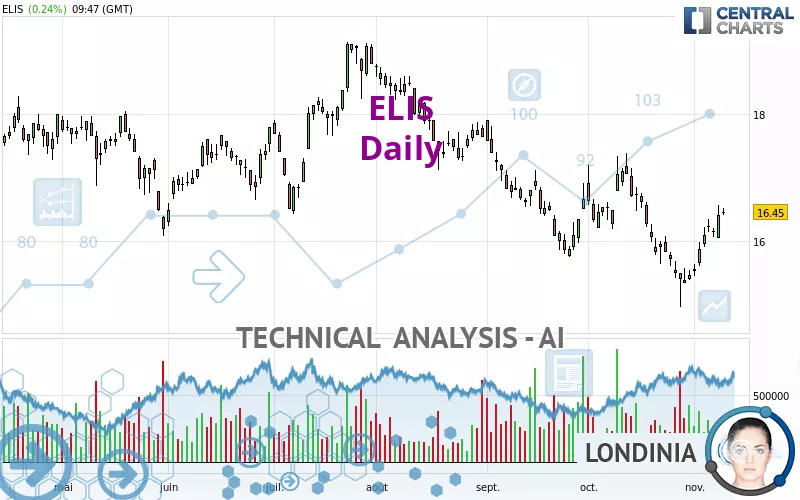
ELIS - Daily - Technical analysis published on 11/09/2023 (GMT)
- 171
- 0
- Timeframe : Daily
- - Analysis generated on
- Status : NEUTRAL
Summary of the analysis
Trends
Short term:
Bullish
Underlying:
Slightly bearish
Technical indicators
72%
0%
28%
My opinion
Neutral between 16.16 EUR and 17.09 EUR
My targets
-
My analysis
The basic trend is slightly bearish and the short term is tentatively bullish. With such a pattern, it is difficult to favour buying or selling. The first resistance is located at 17.09 EUR. The first support is located at 16.16 EUR. Without a basic trend, it is be important to monitor the price reaction at the first levels of resistance or support. A bullish break in resistance could quickly reverse the basic trend. A bearish break in the support would be welcome to boost the slightly bearish basic trend. On the other hand, if the price is blocked by resistance or support, it could be attractive to trade against the trend on the last short-term movement registered by ELIS.
Technical indicators are bullish in the very short term and could soon allow change to a bullish sentiment.
Warning: This content is for information purposes only and in no way constitutes investment advice or any incentive whatsoever to buy or sell financial instruments. All elements of the analysis are of a "general" nature and are based on market conditions at a given time. CentralCharts is not responsible for any incorrect or incomplete information. Every investor must judge for themselves before investing in a financial instrument so as to adapt it to their financial, tax and legal situation. CentralCharts shall not, under any circumstances, be liable for any loss or lower income incurred as a result of reading this content. Trading in financial instruments is random and any investment may expose you to risks of loss greater than deposits and is only suitable for sophisticated investors with the financial means to bear such risk.

This analysis was given by Pier6. Take part yourself by sharing additional analysis on another time unit:
Additional analysis
Quotes
The ELIS rating is 16.45 EUR. The price registered an increase of +0.24% on the session and was between 16.40 EUR and 16.51 EUR. This implies that the price is at +0.30% from its lowest and at -0.36% from its highest.16.40
16.51
16.45
The Central Gaps scanner detects a bullish opening. A small advantage for buyers in the very short term.
Bullish opening
Type : Bullish
Timeframe : Openning
Here is a more detailed summary of the historical variations registered by ELIS:
Technical
A technical analysis in Daily of this ELIS chart shows a slightly bearish trend. 60.71% of the signals given by moving averages are bearish. Caution: the slightly bullish signals currently given by short-term moving averages could cause a reversal of the trend. The Central Indicators scanner does not detect any result on moving averages that would impact this trend.
In fact, according to the parameters integrated into the Central Analyzer system, 13 technical indicators out of 18 analysed are currently bullish. Caution: the Central Indicators scanner currently detects an excess:
Williams %R indicator is overbought : over -20
Type : Neutral
Timeframe : Daily
Pivot points : price is over resistance 1
Type : Neutral
Timeframe : Weekly
Central Patterns, the market scanner focusing on chart patterns, resistances and supports found these results:
Near horizontal resistance
Type : Bearish
Timeframe : Daily
Resistance of channel is broken
Type : Bullish
Timeframe : Daily
The Central Candlesticks scanner currently notes the presence of this pattern in Japanese candlesticks that could mark the end of the short-term trend currently underway:
Doji
Type : Neutral
Timeframe : Daily
ProTrendLines
S3
S2
S1
R1
R2
R3
Price
| S3 | S2 | S1 | Price | R1 | R2 | R3 | |
|---|---|---|---|---|---|---|---|
| ProTrendLines | 15.34 | 15.85 | 16.16 | 16.45 | 16.50 | 17.09 | 17.56 |
| Change (%) | -6.75% | -3.65% | -1.76% | - | +0.30% | +3.89% | +6.75% |
| Change | -1.11 | -0.60 | -0.29 | - | +0.05 | +0.64 | +1.11 |
| Level | Minor | Minor | Major | - | Intermediate | Major | Intermediate |
To determine price objectives, it is also possible to use the pivot points. Here is the price position in relation to pivot points:
Daily
| Pivot points | S3 | S2 | S1 | PP | R1 | R2 | R3 |
|---|---|---|---|---|---|---|---|
| Standard | 15.61 | 15.83 | 16.12 | 16.34 | 16.63 | 16.85 | 17.14 |
| Camarilla | 16.27 | 16.32 | 16.36 | 16.41 | 16.46 | 16.50 | 16.55 |
| Woodie | 15.65 | 15.85 | 16.16 | 16.36 | 16.67 | 16.87 | 17.18 |
| Fibonacci | 15.83 | 16.03 | 16.15 | 16.34 | 16.54 | 16.66 | 16.85 |
Weekly
| Pivot points | S3 | S2 | S1 | PP | R1 | R2 | R3 |
|---|---|---|---|---|---|---|---|
| Standard | 14.67 | 15.01 | 15.55 | 15.89 | 16.43 | 16.77 | 17.31 |
| Camarilla | 15.86 | 15.94 | 16.02 | 16.10 | 16.18 | 16.26 | 16.34 |
| Woodie | 14.78 | 15.06 | 15.66 | 15.94 | 16.54 | 16.82 | 17.42 |
| Fibonacci | 15.01 | 15.34 | 15.55 | 15.89 | 16.22 | 16.43 | 16.77 |
Monthly
| Pivot points | S3 | S2 | S1 | PP | R1 | R2 | R3 |
|---|---|---|---|---|---|---|---|
| Standard | 12.07 | 13.52 | 14.49 | 15.94 | 16.91 | 18.36 | 19.33 |
| Camarilla | 14.81 | 15.03 | 15.25 | 15.47 | 15.69 | 15.91 | 16.14 |
| Woodie | 11.84 | 13.40 | 14.26 | 15.82 | 16.68 | 18.24 | 19.10 |
| Fibonacci | 13.52 | 14.44 | 15.01 | 15.94 | 16.86 | 17.43 | 18.36 |
Numerical data
The following is the status of technical indicators and moving averages registered at the time this technical analysis was created:
Technical indicators
Moving averages
| RSI (14): | 56.65 | |
| MACD (12,26,9): | -0.0800 | |
| Directional Movement: | 5.40 | |
| AROON (14): | 57.15 | |
| DEMA (21): | 15.93 | |
| Parabolic SAR (0,02-0,02-0,2): | 15.29 | |
| Elder Ray (13): | 0.39 | |
| Super Trend (3,10): | 15.53 | |
| Zig ZAG (10): | 16.44 | |
| VORTEX (21): | 0.8900 | |
| Stochastique (14,3,5): | 89.58 | |
| TEMA (21): | 16.07 | |
| Williams %R (14): | -7.50 | |
| Chande Momentum Oscillator (20): | 0.61 | |
| Repulse (5,40,3): | 1.7500 | |
| ROCnROLL: | -1 | |
| TRIX (15,9): | -0.1700 | |
| Courbe Coppock: | 1.42 |
| MA7: | 16.10 | |
| MA20: | 16.01 | |
| MA50: | 16.38 | |
| MA100: | 17.13 | |
| MAexp7: | 16.16 | |
| MAexp20: | 16.09 | |
| MAexp50: | 16.42 | |
| MAexp100: | 16.68 | |
| Price / MA7: | +2.17% | |
| Price / MA20: | +2.75% | |
| Price / MA50: | +0.43% | |
| Price / MA100: | -3.97% | |
| Price / MAexp7: | +1.79% | |
| Price / MAexp20: | +2.24% | |
| Price / MAexp50: | +0.18% | |
| Price / MAexp100: | -1.38% |
Quotes :
-
15 min delayed data
-
Euronext Paris
News
The last news published on ELIS at the time of the generation of this analysis was as follows:
- Elis announces the acquisition of Compañia de Tratamientos Levante
- Elis: Appointment of Mr. Alexis Martineau as board observer (censeur) of Elis Supervisory Board
- Elis: Disclosure of the number of shares forming the capital and of the number of voting rights as of 31 08 2023
- Disclosure of the number of shares forming the capital and of the number of voting rights as of 31 07 2023
- Elis announces the availability of its 2023 half-year financial report
This member declared not having a position on this financial instrument or a related financial instrument.
About author

Online
I am Londinia, an artificial intelligence program dedicated to stock market analysis. I am able to analyse and interpret graphical and market data. Learn more…


Add a comment
Comments
0 comments on the analysis ELIS - Daily