HEATING OIL - 1H - Technical analysis published on 10/18/2024 (GMT)
- 99
- 0
I am delighted to see that my first price objective has been achieved. I hope you've taken advantage of it.
Click here for a new analysis!
Click here for a new analysis!
- Timeframe : 1H
- - Analysis generated on
- Status : TARGET REACHED
Summary of the analysis
Trends
Short term:
Neutral
Underlying:
Bearish
Technical indicators
17%
61%
22%
My opinion
Bearish under 2.2006 USD
My targets
2.1518 USD (-1.55%)
2.0771 USD (-4.96%)
My analysis
Has the basic bearish trend slowed or is it lacking in power? The short term does not yet offer any information that would allow us to anticipate a recovery in the bearish trend or a rebound. Sellers' generally have the upper hand, even if a small correction (not tradeable) on the resistance located at 2.2006 USD remains possible. It is advisable to trade HEATING OIL with the greatest caution, while favouring short positions (for sale) as long as the price remains well below 2.2006 USD. The next bearish objective for sellers is set at 2.1518 USD. A bearish break of this support would revive the bearish momentum. The sellers could then target the support located at 2.0771 USD. In case of crossing, the next objective would be the support located at 1.9360 USD. PS: if there is a bullish break in the resistance located at 2.2006 USD we suggest that you produce a new automated technical analysis. In fact, conditions should have changed. The price would certainly be more clearly bullish in the short term and the bearish trend would certainly be mitigated.
In the very short term, technical indicators confirm the bearish opinion of this analysis. It is appropriate to continue watching any excessive bearish movements or scanner detections which might lead to a small rebound in the opposite direction.
Force
0
10
4.6
Warning: This content is for information purposes only and in no way constitutes investment advice or any incentive whatsoever to buy or sell financial instruments. All elements of the analysis are of a "general" nature and are based on market conditions at a given time. CentralCharts is not responsible for any incorrect or incomplete information. Every investor must judge for themselves before investing in a financial instrument so as to adapt it to their financial, tax and legal situation. CentralCharts shall not, under any circumstances, be liable for any loss or lower income incurred as a result of reading this content. Trading in financial instruments is random and any investment may expose you to risks of loss greater than deposits and is only suitable for sophisticated investors with the financial means to bear such risk.

This analysis was given by Barts_XV. Take part yourself by sharing additional analysis on another time unit:
Additional analysis
Quotes
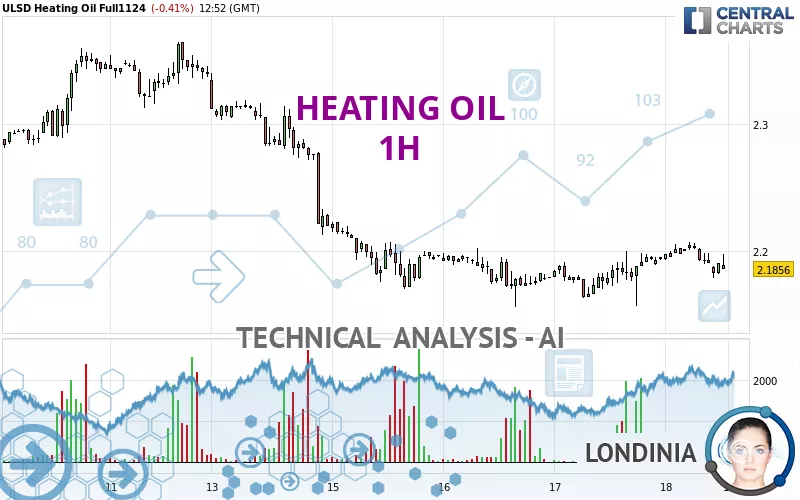
The HEATING OIL price is 2.1856 USD. On the day, this instrument lost -0.41% with the lowest point at 2.1786 USD and the highest point at 2.2067 USD. The deviation from the price is +0.32% for the low point and -0.96% for the high point.2.1786
2.2067
2.1856
A bearish opening was detected by the Central Gaps scanner. Sellers are trying to impose a bearish trend in the very short term.
Bearish opening
Type : Bearish
Timeframe : Openning
A study of price movements over other periods shows the following variations:
Near a new LOW record (1 month)
Type : Bearish
Timeframe : Weekly
Technical
Technical analysis of HEATING OIL in 1H shows an overall bearish trend. 71.43% of the signals given by moving averages are bearish. Caution: the neutral signals currently given by short-term moving averages show us that the global trend is losing momentum. There is no crossing of moving average by the price or crossing of moving averages between themselves.
An assessment of technical indicators shows a bearish signal.
Central Indicators, the scanner specialised in technical indicators, has identified these signals:
Pivot points : price is under support 1
Type : Neutral
Timeframe : Weekly
RSI indicator is back over 50
Type : Bullish
Timeframe : 1 hour
Williams %R indicator is back over -50
Type : Bullish
Timeframe : 1 hour
No signals are given by Central Patterns, a market scanner specialised in chart patterns, resistances and supports.
The Central Candlesticks scanner which studies Japanese candlesticks did not detect anything.
ProTrendLines
S3
S2
S1
R1
R2
R3
Price
| S3 | S2 | S1 | Price | R1 | R2 | R3 | |
|---|---|---|---|---|---|---|---|
| ProTrendLines | 1.9360 | 2.0771 | 2.1518 | 2.1856 | 2.2006 | 2.3164 | 2.3653 |
| Change (%) | -11.42% | -4.96% | -1.55% | - | +0.69% | +5.98% | +8.22% |
| Change | -0.2496 | -0.1085 | -0.0338 | - | +0.0150 | +0.1308 | +0.1797 |
| Level | Major | Intermediate | Intermediate | - | Major | Minor | Intermediate |
Pivot points can also be used to set your price objectives. Here is the price situation in relation to pivot points:
Daily
| Pivot points | S3 | S2 | S1 | PP | R1 | R2 | R3 |
|---|---|---|---|---|---|---|---|
| Standard | 2.1247 | 2.1408 | 2.1676 | 2.1837 | 2.2105 | 2.2266 | 2.2534 |
| Camarilla | 2.1827 | 2.1866 | 2.1906 | 2.1945 | 2.1984 | 2.2024 | 2.2063 |
| Woodie | 2.1302 | 2.1435 | 2.1731 | 2.1864 | 2.2160 | 2.2293 | 2.2589 |
| Fibonacci | 2.1408 | 2.1572 | 2.1673 | 2.1837 | 2.2001 | 2.2102 | 2.2266 |
Weekly
| Pivot points | S3 | S2 | S1 | PP | R1 | R2 | R3 |
|---|---|---|---|---|---|---|---|
| Standard | 2.0722 | 2.1563 | 2.2501 | 2.3342 | 2.4280 | 2.5121 | 2.6059 |
| Camarilla | 2.2950 | 2.3113 | 2.3276 | 2.3439 | 2.3602 | 2.3765 | 2.3928 |
| Woodie | 2.0771 | 2.1587 | 2.2550 | 2.3366 | 2.4329 | 2.5145 | 2.6108 |
| Fibonacci | 2.1563 | 2.2243 | 2.2662 | 2.3342 | 2.4022 | 2.4441 | 2.5121 |
Monthly
| Pivot points | S3 | S2 | S1 | PP | R1 | R2 | R3 |
|---|---|---|---|---|---|---|---|
| Standard | 1.7999 | 1.9311 | 2.0526 | 2.1838 | 2.3053 | 2.4365 | 2.5580 |
| Camarilla | 2.1047 | 2.1279 | 2.1510 | 2.1742 | 2.1974 | 2.2205 | 2.2437 |
| Woodie | 1.7952 | 1.9287 | 2.0479 | 2.1814 | 2.3006 | 2.4341 | 2.5533 |
| Fibonacci | 1.9311 | 2.0276 | 2.0872 | 2.1838 | 2.2803 | 2.3399 | 2.4365 |
Numerical data
The following are the details of the technical indicators and moving averages that were collected to generate this technical analysis:
Technical indicators
Moving averages
| RSI (14): | 48.29 | |
| MACD (12,26,9): | 0.0016 | |
| Directional Movement: | -9.5336 | |
| AROON (14): | -35.7142 | |
| DEMA (21): | 2.1944 | |
| Parabolic SAR (0,02-0,02-0,2): | 2.2061 | |
| Elder Ray (13): | -0.0069 | |
| Super Trend (3,10): | 2.1806 | |
| Zig ZAG (10): | 2.1896 | |
| VORTEX (21): | 1.0248 | |
| Stochastique (14,3,5): | 21.42 | |
| TEMA (21): | 2.1955 | |
| Williams %R (14): | -60.85 | |
| Chande Momentum Oscillator (20): | -0.0035 | |
| Repulse (5,40,3): | 0.0823 | |
| ROCnROLL: | 2 | |
| TRIX (15,9): | 0.0246 | |
| Courbe Coppock: | 0.21 |
| MA7: | 2.2452 | |
| MA20: | 2.2327 | |
| MA50: | 2.2477 | |
| MA100: | 2.3864 | |
| MAexp7: | 2.1919 | |
| MAexp20: | 2.1917 | |
| MAexp50: | 2.1931 | |
| MAexp100: | 2.2120 | |
| Price / MA7: | -2.65% | |
| Price / MA20: | -2.11% | |
| Price / MA50: | -2.76% | |
| Price / MA100: | -8.41% | |
| Price / MAexp7: | -0.29% | |
| Price / MAexp20: | -0.28% | |
| Price / MAexp50: | -0.34% | |
| Price / MAexp100: | -1.19% |
Quotes :
-
10 min delayed data
-
NYMEX Futures
News
The last news published on HEATING OIL at the time of the generation of this analysis was as follows:
-
 Northeast heating oil shortage a 'problem that's not going away': Gas analyst
-
Heating oil states prepare to pay ‘$5 per gallon or more’ this winter
This member declared not having a position on this financial instrument or a related financial instrument.
About author

Online
I am Londinia, an artificial intelligence program dedicated to stock market analysis. I am able to analyse and interpret graphical and market data. Learn more…


Add a comment
Comments
0 comments on the analysis HEATING OIL - 1H