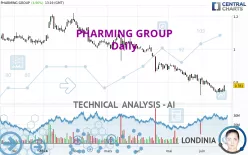
PHARMING GROUP - Daily - Technical analysis published on 06/24/2024 (GMT)
- 145
- 0
Click here for a new analysis!
- Timeframe : Daily
- - Analysis generated on
- Status : LEVEL MAINTAINED

Summary of the analysis

Additional analysis
Quotes
The PHARMING GROUP rating is 0.7810 EUR. The price registered an increase of +4.90% on the session and was between 0.7450 EUR and 0.7820 EUR. This implies that the price is at +4.83% from its lowest and at -0.13% from its highest.Here is a more detailed summary of the historical variations registered by PHARMING GROUP:
Near a new LOW record (1 year)
Type : Bearish
Timeframe : Weekly
Near a new LOW record (1st january)
Type : Bearish
Timeframe : Weekly
Near a new LOW record (1 month)
Type : Bearish
Timeframe : Weekly
Technical
Technical analysis of PHARMING GROUP in Daily shows a overall strongly bearish trend. The signals given by moving averages are 92.86% bearish. This strong bearish trend is confirmed by the strong signals currently being given by short-term moving averages. There is no crossing of moving average by the price or crossing of moving averages between themselves.
On the 18 technical indicators analysed, 7 are bullish, 7 are neutral and 4 are bearish. Other results related to technical indicators were also found by the Central Indicators scanner:
Pivot points : price is over resistance 2
Type : Neutral
Timeframe : Daily
Pivot points : price is over resistance 2
Type : Neutral
Timeframe : Weekly
Williams %R indicator is back over -50
Type : Bullish
Timeframe : Daily
The Central Patterns scanner, which studies chart patterns, resistances and supports, has identified this signal:
Near resistance of channel
Type : Bearish
Timeframe : Daily
The Central Candlesticks scanner, specialised in Japanese candlesticks, did not identify any signals.
| S1 | Price | R1 | R2 | R3 | |
|---|---|---|---|---|---|
| ProTrendLines | 0.6739 | 0.7810 | 0.8680 | 0.9203 | 1.0502 |
| Change (%) | -13.71% | - | +11.14% | +17.84% | +34.47% |
| Change | -0.1071 | - | +0.0870 | +0.1393 | +0.2692 |
| Level | Major | - | Minor | Minor | Major |
Attention could also be paid to pivot points to set price objectives:
| Pivot points | S3 | S2 | S1 | PP | R1 | R2 | R3 |
|---|---|---|---|---|---|---|---|
| Standard | 0.7118 | 0.7262 | 0.7353 | 0.7497 | 0.7588 | 0.7732 | 0.7823 |
| Camarilla | 0.7380 | 0.7402 | 0.7424 | 0.7445 | 0.7467 | 0.7488 | 0.7510 |
| Woodie | 0.7093 | 0.7249 | 0.7328 | 0.7484 | 0.7563 | 0.7719 | 0.7798 |
| Fibonacci | 0.7262 | 0.7351 | 0.7407 | 0.7497 | 0.7586 | 0.7642 | 0.7732 |
| Pivot points | S3 | S2 | S1 | PP | R1 | R2 | R3 |
|---|---|---|---|---|---|---|---|
| Standard | 0.7003 | 0.7172 | 0.7308 | 0.7477 | 0.7613 | 0.7782 | 0.7918 |
| Camarilla | 0.7361 | 0.7389 | 0.7417 | 0.7445 | 0.7473 | 0.7501 | 0.7529 |
| Woodie | 0.6988 | 0.7164 | 0.7293 | 0.7469 | 0.7598 | 0.7774 | 0.7903 |
| Fibonacci | 0.7172 | 0.7288 | 0.7360 | 0.7477 | 0.7593 | 0.7665 | 0.7782 |
| Pivot points | S3 | S2 | S1 | PP | R1 | R2 | R3 |
|---|---|---|---|---|---|---|---|
| Standard | 0.5317 | 0.6268 | 0.7237 | 0.8188 | 0.9157 | 1.0108 | 1.1077 |
| Camarilla | 0.7677 | 0.7853 | 0.8029 | 0.8205 | 0.8381 | 0.8557 | 0.8733 |
| Woodie | 0.5325 | 0.6273 | 0.7245 | 0.8193 | 0.9165 | 1.0113 | 1.1085 |
| Fibonacci | 0.6268 | 0.7002 | 0.7455 | 0.8188 | 0.8922 | 0.9375 | 1.0108 |
Numerical data
The following are the details of the technical indicators and moving averages that were collected to generate this technical analysis:
| RSI (14): | 45.81 | |
| MACD (12,26,9): | -0.0276 | |
| Directional Movement: | -11.7722 | |
| AROON (14): | -50.0000 | |
| DEMA (21): | 0.7425 | |
| Parabolic SAR (0,02-0,02-0,2): | 0.8226 | |
| Elder Ray (13): | -0.0043 | |
| Super Trend (3,10): | 0.8110 | |
| Zig ZAG (10): | 0.7810 | |
| VORTEX (21): | 0.8638 | |
| Stochastique (14,3,5): | 30.21 | |
| TEMA (21): | 0.7451 | |
| Williams %R (14): | -43.03 | |
| Chande Momentum Oscillator (20): | -0.0190 | |
| Repulse (5,40,3): | 3.8516 | |
| ROCnROLL: | -1 | |
| TRIX (15,9): | -0.5302 | |
| Courbe Coppock: | 13.72 |
| MA7: | 0.7521 | |
| MA20: | 0.7816 | |
| MA50: | 0.8413 | |
| MA100: | 0.9428 | |
| MAexp7: | 0.7601 | |
| MAexp20: | 0.7811 | |
| MAexp50: | 0.8409 | |
| MAexp100: | 0.9124 | |
| Price / MA7: | +3.84% | |
| Price / MA20: | -0.08% | |
| Price / MA50: | -7.17% | |
| Price / MA100: | -17.16% | |
| Price / MAexp7: | +2.75% | |
| Price / MAexp20: | -0.01% | |
| Price / MAexp50: | -7.12% | |
| Price / MAexp100: | -14.40% |
News
The latest news and videos published on PHARMING GROUP at the time of the analysis were as follows:
- Pharming Group to participate in June investor conferences
- Pharming Group provides update on ongoing regulatory review of leniolisib for the treatment of APDS in the European Union
- Pharming Group reports on results of the 2024 Annual General Meeting of Shareholders
- Pharming Group to participate in May investor conference
- Pharming Group announces the early redemption of the remaining outstanding €125 million convertible bonds due 2025
About author
Online


Add a comment
Comments
0 comments on the analysis PHARMING GROUP - Daily