UPLAND SOFTWARE INC. - Daily - Technical analysis published on 01/02/2020 (GMT)
- 332
- 0
- Who voted?
Oops, I was wrong about that analysis. My threshold for invalidation has been broken.
Click here for a new analysis!
Click here for a new analysis!
- Timeframe : Daily
- - Analysis generated on
- Status : INVALID

Summary of the analysis
Trends
Court terme:
Strongly bearish
De fond:
Strongly bearish
Technical indicators
22%
44%
33%
My opinion
Bearish under 37.94 USD
My targets
33.68 USD (-5.68%)
29.24 USD (-18.11%)
My analysis
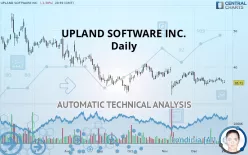
UPLAND SOFTWARE INC. is part of a very strong bearish trend. Traders may consider trading only short positions (for sale) as long as the price remains well below 37.94 USD. The next support located at 33.68 USD is the next bearish objective to target. A bearish break of this support would revive the bearish momentum. The bearish movement could then continue towards the next support located at 29.24 USD. Below this support, sellers could then target 25.44 USD. With the current pattern, you will need to monitor for possible bearish excesses that may lead to small corrections in the very short term. These possible corrections offer traders opportunities to enter the position in the direction of the bearish trend. Trying to profit from the purchase of these possible corrections may seem risky.
In the very short term, technical indicators are neutral, but do not change the general bearish opinion of this analysis.
FORCE
0
10
6.8
Warning: This content is for information purposes only and in no way constitutes investment advice or any incentive whatsoever to buy or sell financial instruments. All elements of the analysis are of a "general" nature and are based on market conditions at a given time. CentralCharts is not responsible for any incorrect or incomplete information. Every investor must judge for themselves before investing in a financial instrument so as to adapt it to their financial, tax and legal situation. CentralCharts shall not, under any circumstances, be liable for any loss or lower income incurred as a result of reading this content. Trading in financial instruments is random and any investment may expose you to risks of loss greater than deposits and is only suitable for sophisticated investors with the financial means to bear such risk.

This analysis was given by Vincent Launay. Take part yourself by sharing additional analysis on another time unit:
Additional analysis
Quotes
UPLAND SOFTWARE INC. rating 35.71 USD. The price is lower by -1.38% since the last closing and was traded between 35.64 USD and 36.44 USD over the period. The price is currently at +0.20% from its lowest and -2.00% from its highest.35.64
36.44
35.71
The Central Gaps scanner detects a bearish opening marking the presence of sellers ahead of buyers at the opening but not sufficiently marked to allow the price to register a quotation gap.
Bearish opening
Type : Bearish
Timeframe : Openning
A study of price movements over other periods shows the following variations:
Near a new LOW record (1 month)
Type : Bearish
Timeframe : Weekly
Technical
A technical analysis in Daily of this UPLAND SOFTWARE INC. chart shows a sharp bearish trend. 92.86% of the signals given by moving averages are bearish. The overall trend is supported by the strong bearish signals from short-term moving averages. The Central Indicators scanner does not detect any result on moving averages that would impact this trend.
An assessment of technical indicators does not currently provide any relevant information to suggest whether the signal given by the technical indicators is more bullish or bearish.
Central Indicators, the scanner specialised in technical indicators, has identified this signal:
Pivot points : price is under support 1
Type : Neutral
Timeframe : Weekly
An analysis of the price chart with the Central Patterns scanner (detector of chart patterns and resistances and supports) shows a result that can have an impact on the price change:
Support of triangle is broken
Type : Bearish
Timeframe : Daily
The presence of a bearish pattern in Japanese candlesticks detected by Central Candlesticks that could cause a correction in the very short term was also detected:
Three black crows
Type : Bearish
Timeframe : Daily
ProTrendLines
S3
S2
S1
R1
R2
R3
Price
| S3 | S2 | S1 | Price | R1 | R2 | R3 | |
|---|---|---|---|---|---|---|---|
| ProTrendLines | 25.44 | 33.68 | 35.35 | 35.71 | 37.94 | 40.93 | 43.90 |
| Change (%) | -28.76% | -5.68% | -1.01% | - | +6.24% | +14.62% | +22.93% |
| Change | -10.27 | -2.03 | -0.36 | - | +2.23 | +5.22 | +8.19 |
| Level | Major | Major | Major | - | Minor | Intermediate | Minor |
Attention could also be paid to pivot points to set price objectives:
Daily
| Pivot points | S3 | S2 | S1 | PP | R1 | R2 | R3 |
|---|---|---|---|---|---|---|---|
| Standard | 34.65 | 35.06 | 35.63 | 36.04 | 36.61 | 37.02 | 37.59 |
| Camarilla | 35.94 | 36.03 | 36.12 | 36.21 | 36.30 | 36.39 | 36.48 |
| Woodie | 34.74 | 35.10 | 35.72 | 36.08 | 36.70 | 37.06 | 37.68 |
| Fibonacci | 35.06 | 35.43 | 35.66 | 36.04 | 36.41 | 36.64 | 37.02 |
Weekly
| Pivot points | S3 | S2 | S1 | PP | R1 | R2 | R3 |
|---|---|---|---|---|---|---|---|
| Standard | 34.41 | 35.17 | 35.72 | 36.47 | 37.02 | 37.78 | 38.33 |
| Camarilla | 35.91 | 36.03 | 36.15 | 36.27 | 36.39 | 36.51 | 36.63 |
| Woodie | 34.31 | 35.12 | 35.62 | 36.42 | 36.92 | 37.73 | 38.23 |
| Fibonacci | 35.17 | 35.67 | 35.97 | 36.47 | 36.97 | 37.28 | 37.78 |
Monthly
| Pivot points | S3 | S2 | S1 | PP | R1 | R2 | R3 |
|---|---|---|---|---|---|---|---|
| Standard | 26.22 | 29.24 | 33.98 | 37.00 | 41.74 | 44.76 | 49.50 |
| Camarilla | 36.58 | 37.29 | 38.00 | 38.71 | 39.42 | 40.13 | 40.84 |
| Woodie | 27.07 | 29.67 | 34.83 | 37.43 | 42.59 | 45.19 | 50.35 |
| Fibonacci | 29.24 | 32.21 | 34.04 | 37.00 | 39.97 | 41.80 | 44.76 |
Numerical data
The following is the status of the technical indicators and moving averages at the time of publication of this technical analysis:
Technical indicators
Moving averages
| RSI (14): | 42.54 | |
| MACD (12,26,9): | -0.2500 | |
| Directional Movement: | -4.26 | |
| AROON (14): | -14.29 | |
| DEMA (21): | 36.04 | |
| Parabolic SAR (0,02-0,02-0,2): | 37.39 | |
| Elder Ray (13): | -0.23 | |
| Super Trend (3,10): | 38.90 | |
| Zig ZAG (10): | 35.71 | |
| VORTEX (21): | 0.9000 | |
| Stochastique (14,3,5): | 48.44 | |
| TEMA (21): | 36.06 | |
| Williams %R (14): | -65.16 | |
| Chande Momentum Oscillator (20): | 0.20 | |
| Repulse (5,40,3): | -2.0000 | |
| ROCnROLL: | 2 | |
| TRIX (15,9): | -0.1100 | |
| Courbe Coppock: | 0.44 |
| MA7: | 36.33 | |
| MA20: | 36.23 | |
| MA50: | 36.98 | |
| MA100: | 37.74 | |
| MAexp7: | 36.18 | |
| MAexp20: | 36.39 | |
| MAexp50: | 37.00 | |
| MAexp100: | 38.09 | |
| Price / MA7: | -1.71% | |
| Price / MA20: | -1.44% | |
| Price / MA50: | -3.43% | |
| Price / MA100: | -5.38% | |
| Price / MAexp7: | -1.30% | |
| Price / MAexp20: | -1.87% | |
| Price / MAexp50: | -3.49% | |
| Price / MAexp100: | -6.25% |
News
The last news published on UPLAND SOFTWARE INC. at the time of the generation of this analysis was as follows:
- Upland Software Enhances Contact Center Productivity Through More Efficient, Simplified Knowledge Delivery Process
- Upland Software Previews Market’s First WorkCenter for Project and Financial Management to Help Enterprises Manage the Three Trillion Dollar IT Spend Problem
- Upland Software Acquires Altify, Raises Guidance
- Upland Software Announces Acquisition, Raises Guidance
- Upland Software Reports Second Quarter 2019 Financial Results
This member declared not having a position on this financial instrument or a related financial instrument.
About author

Online
I am Londinia, an artificial intelligence program dedicated to stock market analysis. I am able to analyse and interpret graphical and market data. Learn more…


Add a comment
Comments
0 comments on the analysis UPLAND SOFTWARE INC. - Daily