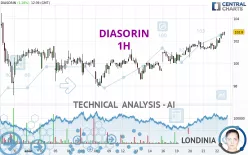
DIASORIN - 1H - Technical analysis published on 08/22/2024 (GMT)
- 103
- 0
Click here for a new analysis!
- Timeframe : 1H
- - Analysis generated on
- Status : INVALID

Summary of the analysis

Additional analysis
Quotes
The DIASORIN price is 102.80 EUR. The price has increased by +1.28% since the last closing with the lowest point at 101.35 EUR and the highest point at 102.85 EUR. The deviation from the price is +1.43% for the low point and -0.05% for the high point.A study of price movements over other periods shows the following variations:
Near a new HIGH record (1 year)
Type : Bullish
Timeframe : Weekly
Near a new HIGH record (1st january)
Type : Bullish
Timeframe : Weekly
Near a new LOW record (1 month)
Type : Bearish
Timeframe : Weekly
Technical
Technical analysis of DIASORIN in 1H shows a strongly overall bullish trend. The signals given by the moving averages are 92.86% bullish. This strong bullish trend is confirmed by the strong signals currently being given by short-term moving averages. The Central Indicators scanner does not detect any result on moving averages that would impact this trend.
An assessment of technical indicators shows a strong bullish signal.
Caution: the Central Indicators scanner currently detects an excess:
CCI indicator is overbought : over 100
Type : Neutral
Timeframe : 1 hour
Williams %R indicator is overbought : over -20
Type : Neutral
Timeframe : 1 hour
Pivot points : price is over resistance 1
Type : Neutral
Timeframe : Weekly
Pivot points : price is over resistance 3
Type : Neutral
Timeframe : 1 hour
The Central Patterns scanner, which studies chart patterns, resistances and supports, has identified these signals:
Near horizontal resistance
Type : Bearish
Timeframe : 1 hour
Resistance of channel is broken
Type : Bullish
Timeframe : 1 hour
The Central Candlesticks scanner, specialised in Japanese candlesticks, did not identify any signals.
| S3 | S2 | S1 | Price | R1 | R2 | R3 | |
|---|---|---|---|---|---|---|---|
| ProTrendLines | 100.43 | 101.20 | 102.04 | 102.80 | 103.50 | 104.40 | 105.70 |
| Change (%) | -2.31% | -1.56% | -0.74% | - | +0.68% | +1.56% | +2.82% |
| Change | -2.37 | -1.60 | -0.76 | - | +0.70 | +1.60 | +2.90 |
| Level | Minor | Major | Intermediate | - | Minor | Major | Intermediate |
Pivot points can also be used to set your price objectives. Here is the price situation in relation to pivot points:
| Pivot points | S3 | S2 | S1 | PP | R1 | R2 | R3 |
|---|---|---|---|---|---|---|---|
| Standard | 100.47 | 100.83 | 101.17 | 101.53 | 101.87 | 102.23 | 102.57 |
| Camarilla | 101.31 | 101.37 | 101.44 | 101.50 | 101.56 | 101.63 | 101.69 |
| Woodie | 100.45 | 100.83 | 101.15 | 101.53 | 101.85 | 102.23 | 102.55 |
| Fibonacci | 100.83 | 101.10 | 101.27 | 101.53 | 101.80 | 101.97 | 102.23 |
| Pivot points | S3 | S2 | S1 | PP | R1 | R2 | R3 |
|---|---|---|---|---|---|---|---|
| Standard | 96.17 | 97.34 | 98.90 | 100.07 | 101.63 | 102.80 | 104.36 |
| Camarilla | 99.70 | 99.95 | 100.20 | 100.45 | 100.70 | 100.95 | 101.20 |
| Woodie | 96.36 | 97.44 | 99.09 | 100.17 | 101.82 | 102.90 | 104.55 |
| Fibonacci | 97.34 | 98.39 | 99.03 | 100.07 | 101.12 | 101.76 | 102.80 |
| Pivot points | S3 | S2 | S1 | PP | R1 | R2 | R3 |
|---|---|---|---|---|---|---|---|
| Standard | 79.97 | 86.05 | 93.53 | 99.61 | 107.09 | 113.17 | 120.65 |
| Camarilla | 97.27 | 98.51 | 99.76 | 101.00 | 102.24 | 103.49 | 104.73 |
| Woodie | 80.66 | 86.40 | 94.22 | 99.96 | 107.78 | 113.52 | 121.34 |
| Fibonacci | 86.05 | 91.23 | 94.43 | 99.61 | 104.79 | 107.99 | 113.17 |
Numerical data
The following is the status of the technical indicators and moving averages at the time of publication of this technical analysis:
| RSI (14): | 66.44 | |
| MACD (12,26,9): | 0.4000 | |
| Directional Movement: | 23.29 | |
| AROON (14): | 92.86 | |
| DEMA (21): | 102.34 | |
| Parabolic SAR (0,02-0,02-0,2): | 101.41 | |
| Elder Ray (13): | 0.63 | |
| Super Trend (3,10): | 101.47 | |
| Zig ZAG (10): | 102.75 | |
| VORTEX (21): | 1.1200 | |
| Stochastique (14,3,5): | 92.77 | |
| TEMA (21): | 102.45 | |
| Williams %R (14): | -6.06 | |
| Chande Momentum Oscillator (20): | 1.40 | |
| Repulse (5,40,3): | 0.5500 | |
| ROCnROLL: | 1 | |
| TRIX (15,9): | 0.0400 | |
| Courbe Coppock: | 1.45 |
| MA7: | 100.93 | |
| MA20: | 101.00 | |
| MA50: | 99.51 | |
| MA100: | 97.02 | |
| MAexp7: | 102.33 | |
| MAexp20: | 101.83 | |
| MAexp50: | 101.24 | |
| MAexp100: | 100.90 | |
| Price / MA7: | +1.85% | |
| Price / MA20: | +1.78% | |
| Price / MA50: | +3.31% | |
| Price / MA100: | +5.96% | |
| Price / MAexp7: | +0.46% | |
| Price / MAexp20: | +0.95% | |
| Price / MAexp50: | +1.54% | |
| Price / MAexp100: | +1.88% |
About author
Online


Add a comment
Comments
0 comments on the analysis DIASORIN - 1H