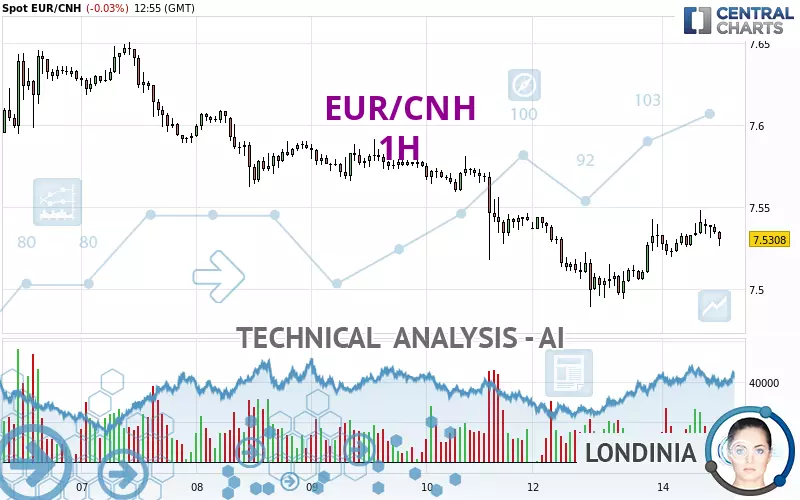
EUR/CNH - 1H - Technical analysis published on 01/14/2025 (GMT)
- 103
- 0
- Timeframe : 1H
- - Analysis generated on
- Status : NEUTRAL
Summary of the analysis

Additional analysis
Quotes
The EUR/CNH price is 7.53080 CNH. The price registered a decrease of -0.03% on the session with the lowest point at 7.51990 CNH and the highest point at 7.54842 CNH. The deviation from the price is +0.14% for the low point and -0.23% for the high point.The Central Gaps scanner detects a bearish opening marking the presence of sellers ahead of buyers at the opening but not sufficiently marked to allow the price to register a quotation gap.
Bearish opening
Type : Bearish
Timeframe : Openning
Here is a more detailed summary of the historical variations registered by EUR/CNH:
Near a new LOW record (1 year)
Type : Bearish
Timeframe : Weekly
Near a new HIGH record (1st january)
Type : Bullish
Timeframe : Weekly
Near a new HIGH record (1 month)
Type : Bullish
Timeframe : Weekly
Technical
Technical analysis of this 1H chart of EUR/CNH indicates that the overall trend is slightly bearish. 57.14% of the signals given by moving averages are bearish. Caution: the slightly bullish signals currently being given by short-term moving averages indicate that this overall trend could be reversed. An assessment of moving averages reveals several bullish signals that could impact this trend:
Moving Average bullish crossovers : MA20 & MA50
Type : Bullish
Timeframe : 1 hour
Moving Average bullish crossovers : AMA20 & AMA50
Type : Bullish
Timeframe : 1 hour
In fact, only 7 technical indicators out of 18 studied are currently bullish. Central Indicators, the detector scanner for these technical indicators has recently detected several signals:
Parabolic SAR indicator bearish reversal
Type : Bearish
Timeframe : 1 hour
Momentum indicator is back under 0
Type : Bearish
Timeframe : 1 hour
Williams %R indicator is back under -50
Type : Bearish
Timeframe : 1 hour
Central Patterns, the market scanner focusing on chart patterns, resistances and supports found these results:
Near horizontal resistance
Type : Bearish
Timeframe : 1 hour
Resistance of channel is broken
Type : Bullish
Timeframe : 1 hour
The Central Candlesticks scanner, specialised in Japanese candlesticks, did not identify any signals.
| S3 | S2 | S1 | Price | R1 | R2 | R3 | |
|---|---|---|---|---|---|---|---|
| ProTrendLines | 7.20429 | 7.49407 | 7.51900 | 7.53080 | 7.56377 | 7.59048 | 7.61841 |
| Change (%) | -4.34% | -0.49% | -0.16% | - | +0.44% | +0.79% | +1.16% |
| Change | -0.32651 | -0.03673 | -0.01180 | - | +0.03297 | +0.05968 | +0.08761 |
| Level | Intermediate | Intermediate | Major | - | Intermediate | Major | Minor |
Pivot points can also be used to set your price objectives. Here is the price situation in relation to pivot points:
| Pivot points | S3 | S2 | S1 | PP | R1 | R2 | R3 |
|---|---|---|---|---|---|---|---|
| Standard | 7.44508 | 7.46718 | 7.50001 | 7.52211 | 7.55494 | 7.57704 | 7.60987 |
| Camarilla | 7.51774 | 7.52278 | 7.52782 | 7.53285 | 7.53789 | 7.54292 | 7.54796 |
| Woodie | 7.45046 | 7.46986 | 7.50539 | 7.52479 | 7.56032 | 7.57972 | 7.61525 |
| Fibonacci | 7.46718 | 7.48816 | 7.50112 | 7.52211 | 7.54309 | 7.55605 | 7.57704 |
| Pivot points | S3 | S2 | S1 | PP | R1 | R2 | R3 |
|---|---|---|---|---|---|---|---|
| Standard | 7.35861 | 7.43838 | 7.49108 | 7.57085 | 7.62355 | 7.70332 | 7.75602 |
| Camarilla | 7.50735 | 7.51949 | 7.53164 | 7.54378 | 7.55592 | 7.56807 | 7.58021 |
| Woodie | 7.34508 | 7.43161 | 7.47755 | 7.56408 | 7.61002 | 7.69655 | 7.74249 |
| Fibonacci | 7.43838 | 7.48898 | 7.52025 | 7.57085 | 7.62145 | 7.65272 | 7.70332 |
| Pivot points | S3 | S2 | S1 | PP | R1 | R2 | R3 |
|---|---|---|---|---|---|---|---|
| Standard | 7.37666 | 7.46748 | 7.53181 | 7.62263 | 7.68696 | 7.77778 | 7.84211 |
| Camarilla | 7.55348 | 7.56771 | 7.58193 | 7.59615 | 7.61037 | 7.62459 | 7.63882 |
| Woodie | 7.36343 | 7.46086 | 7.51858 | 7.61601 | 7.67373 | 7.77116 | 7.82888 |
| Fibonacci | 7.46748 | 7.52674 | 7.56336 | 7.62263 | 7.68189 | 7.71851 | 7.77778 |
Numerical data
The following is the status of technical indicators and moving averages registered at the time this technical analysis was created:
| RSI (14): | 55.42 | |
| MACD (12,26,9): | 0.0036 | |
| Directional Movement: | 6.26100 | |
| AROON (14): | 42.85714 | |
| DEMA (21): | 7.53293 | |
| Parabolic SAR (0,02-0,02-0,2): | 7.54842 | |
| Elder Ray (13): | -0.00103 | |
| Super Trend (3,10): | 7.51075 | |
| Zig ZAG (10): | 7.53340 | |
| VORTEX (21): | 1.1440 | |
| Stochastique (14,3,5): | 58.19 | |
| TEMA (21): | 7.54041 | |
| Williams %R (14): | -50.28 | |
| Chande Momentum Oscillator (20): | 0.00602 | |
| Repulse (5,40,3): | 0.0300 | |
| ROCnROLL: | -1 | |
| TRIX (15,9): | 0.0046 | |
| Courbe Coppock: | 0.43 |
| MA7: | 7.57059 | |
| MA20: | 7.59138 | |
| MA50: | 7.63361 | |
| MA100: | 7.72038 | |
| MAexp7: | 7.53484 | |
| MAexp20: | 7.52943 | |
| MAexp50: | 7.53312 | |
| MAexp100: | 7.54810 | |
| Price / MA7: | -0.53% | |
| Price / MA20: | -0.80% | |
| Price / MA50: | -1.35% | |
| Price / MA100: | -2.46% | |
| Price / MAexp7: | -0.05% | |
| Price / MAexp20: | +0.02% | |
| Price / MAexp50: | -0.03% | |
| Price / MAexp100: | -0.23% |
About author
Online


Add a comment
Comments
0 comments on the analysis EUR/CNH - 1H