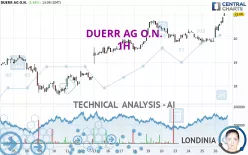
DUERR AG O.N. - 1H - Technical analysis published on 09/26/2024 (GMT)
- 146
- 0
Click here for a new analysis!
- Timeframe : 1H
- - Analysis generated on
- Status : TARGET REACHED

Summary of the analysis

Additional analysis
Quotes
DUERR AG O.N. rating 21.06 EUR. The price has increased by +5.94% since the last closing with the lowest point at 20.06 EUR and the highest point at 21.08 EUR. The deviation from the price is +4.99% for the low point and -0.09% for the high point.The Central Gaps scanner detects a bullish gap which is a sign that buyers have taken the lead in the very short term.
Opening Gap UP
Type : Bullish
Timeframe : Openning
Here is a more detailed summary of the historical variations registered by DUERR AG O.N.:
New HIGH record (1 month)
Type : Bullish
Timeframe : Weekly
Technical
Technical analysis of DUERR AG O.N. in 1H shows a strongly overall bullish trend. 89.29% of the signals given by moving averages are bullish. This strongly bullish trend is supported by the strong bullish signals given by short-term moving averages. The Central Indicators scanner does not detect any result on moving averages that would impact this trend.
An assessment of technical indicators shows a strong bullish signal.
Caution: the Central Indicators scanner currently detects an excess:
RSI indicator is overbought : over 70
Type : Neutral
Timeframe : 1 hour
CCI indicator is overbought : over 100
Type : Neutral
Timeframe : 1 hour
Williams %R indicator is overbought : over -20
Type : Neutral
Timeframe : 1 hour
Pivot points : price is over resistance 1
Type : Neutral
Timeframe : Weekly
Pivot points : price is over resistance 3
Type : Neutral
Timeframe : 1 hour
An analysis of the price chart with the Central Patterns scanner (detector of chart patterns and resistances and supports) shows a result that can have an impact on the price change:
Near resistance of channel
Type : Bearish
Timeframe : 1 hour
Central Candlesticks, the scanner specialised in Japanese candlesticks, detects a bullish signal that could support the hypothesis of a small rebound in the very short term:
Upside gap
Type : Bullish
Timeframe : 1 hour
| S3 | S2 | S1 | Price | R1 | R2 | R3 | |
|---|---|---|---|---|---|---|---|
| ProTrendLines | 19.77 | 20.40 | 20.76 | 21.06 | 21.36 | 22.62 | 25.66 |
| Change (%) | -6.13% | -3.13% | -1.42% | - | +1.42% | +7.41% | +21.84% |
| Change | -1.29 | -0.66 | -0.30 | - | +0.30 | +1.56 | +4.60 |
| Level | Major | Minor | Intermediate | - | Minor | Intermediate | Intermediate |
To determine price objectives, it is also possible to use the pivot points. Here is the price position in relation to pivot points:
| Pivot points | S3 | S2 | S1 | PP | R1 | R2 | R3 |
|---|---|---|---|---|---|---|---|
| Standard | 19.55 | 19.68 | 19.78 | 19.91 | 20.01 | 20.14 | 20.24 |
| Camarilla | 19.82 | 19.84 | 19.86 | 19.88 | 19.90 | 19.92 | 19.94 |
| Woodie | 19.54 | 19.67 | 19.77 | 19.90 | 20.00 | 20.13 | 20.23 |
| Fibonacci | 19.68 | 19.77 | 19.82 | 19.91 | 20.00 | 20.05 | 20.14 |
| Pivot points | S3 | S2 | S1 | PP | R1 | R2 | R3 |
|---|---|---|---|---|---|---|---|
| Standard | 18.05 | 18.73 | 19.41 | 20.09 | 20.77 | 21.45 | 22.13 |
| Camarilla | 19.73 | 19.85 | 19.98 | 20.10 | 20.23 | 20.35 | 20.47 |
| Woodie | 18.06 | 18.73 | 19.42 | 20.09 | 20.78 | 21.45 | 22.14 |
| Fibonacci | 18.73 | 19.25 | 19.57 | 20.09 | 20.61 | 20.93 | 21.45 |
| Pivot points | S3 | S2 | S1 | PP | R1 | R2 | R3 |
|---|---|---|---|---|---|---|---|
| Standard | 15.81 | 17.20 | 18.47 | 19.86 | 21.13 | 22.52 | 23.79 |
| Camarilla | 19.02 | 19.26 | 19.51 | 19.75 | 19.99 | 20.24 | 20.48 |
| Woodie | 15.76 | 17.17 | 18.42 | 19.83 | 21.08 | 22.49 | 23.74 |
| Fibonacci | 17.20 | 18.21 | 18.84 | 19.86 | 20.87 | 21.50 | 22.52 |
Numerical data
The following is the status of the technical indicators and moving averages at the time of publication of this technical analysis:
| RSI (14): | 74.36 | |
| MACD (12,26,9): | 0.1500 | |
| Directional Movement: | 31.15 | |
| AROON (14): | 100.00 | |
| DEMA (21): | 20.42 | |
| Parabolic SAR (0,02-0,02-0,2): | 19.98 | |
| Elder Ray (13): | 0.43 | |
| Super Trend (3,10): | 20.27 | |
| Zig ZAG (10): | 20.88 | |
| VORTEX (21): | 1.0700 | |
| Stochastique (14,3,5): | 95.90 | |
| TEMA (21): | 20.55 | |
| Williams %R (14): | -3.70 | |
| Chande Momentum Oscillator (20): | 0.96 | |
| Repulse (5,40,3): | 1.6100 | |
| ROCnROLL: | 1 | |
| TRIX (15,9): | 0.0300 | |
| Courbe Coppock: | 4.78 |
| MA7: | 20.21 | |
| MA20: | 19.34 | |
| MA50: | 19.60 | |
| MA100: | 20.95 | |
| MAexp7: | 20.53 | |
| MAexp20: | 20.27 | |
| MAexp50: | 20.10 | |
| MAexp100: | 19.84 | |
| Price / MA7: | +4.21% | |
| Price / MA20: | +8.89% | |
| Price / MA50: | +7.45% | |
| Price / MA100: | +0.53% | |
| Price / MAexp7: | +2.58% | |
| Price / MAexp20: | +3.90% | |
| Price / MAexp50: | +4.78% | |
| Price / MAexp100: | +6.15% |
News
Don't forget to follow the news on DUERR AG O.N.. At the time of publication of this analysis, the latest news was as follows:
- EQS-Adhoc: Dürr Group reviews strategic options for the environmental technology business and combines painting and final assembly technology in the new Automotive division
- EQS-Adhoc: Dürr Group sells Danish subsidiary Agramkow
- EQS-Adhoc: Dürr Aktiengesellschaft: Package of measures adopted to boost efficiency and reduce capacity at HOMAG
- EQS-Adhoc: Dürr AG: Earnings target for 2024 revised, forecast for 2023 confirmed
- EQS-Adhoc: Dürr AG strongly expands automation business with acquisition of BBS Automation
About author
Online


Add a comment
Comments
0 comments on the analysis DUERR AG O.N. - 1H