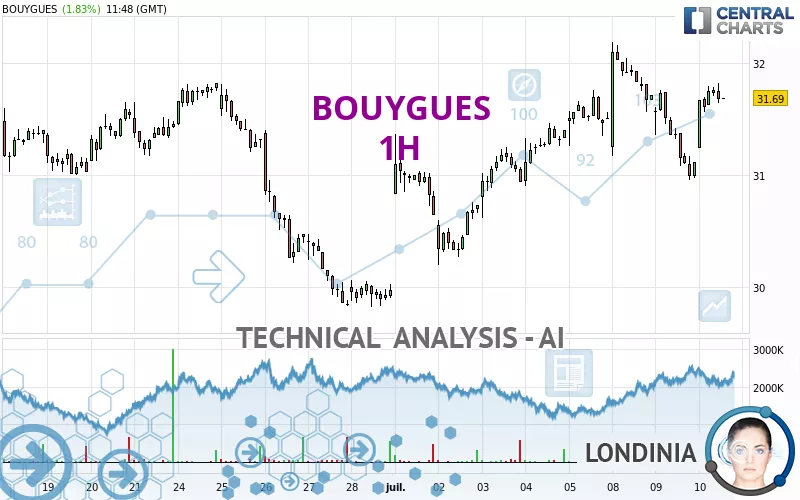
BOUYGUES - 1H - Technical analysis published on 07/10/2024 (GMT)
- 179
- 0
Click here for a new analysis!
- Timeframe : 1H
- - Analysis generated on
- Status : LEVEL MAINTAINED

Summary of the analysis

Additional analysis
Quotes
The BOUYGUES rating is 31.67 EUR. The price registered an increase of +1.77% on the session with the lowest point at 31.24 EUR and the highest point at 31.82 EUR. The deviation from the price is +1.38% for the low point and -0.47% for the high point.The Central Gaps scanner detects a bullish opening. A small advantage for buyers in the very short term.
Bullish opening
Type : Bullish
Timeframe : Openning
So that you have an overall view of the price change, here is a table showing the variations over several periods:
Near a new LOW record (1st january)
Type : Bearish
Timeframe : Weekly
Near a new LOW record (1 month)
Type : Bearish
Timeframe : Weekly
Technical
Technical analysis of BOUYGUES in 1H shows a strongly overall bullish trend. 89.29% of the signals given by moving averages are bullish. The slightly bullish signals given by the short-term moving averages show a weakening of the global trend. The Central Indicators market scanner currently does not detect any result that concerns moving averages.
An assessment of technical indicators shows a moderate bullish signal.
But beware of excesses. The Central Indicators scanner currently detects this:
Williams %R indicator is overbought : over -20
Type : Neutral
Timeframe : 1 hour
Pivot points : price is over resistance 1
Type : Neutral
Timeframe : 1 hour
Aroon indicator bullish trend
Type : Bullish
Timeframe : 1 hour
Momentum indicator is back under 0
Type : Bearish
Timeframe : 1 hour
Central Patterns, the scanner specializing in chart patterns, did not identify any signals.
The Central Candlesticks scanner which studies Japanese candlesticks did not detect anything.
| S3 | S2 | S1 | Price | R1 | R2 | R3 | |
|---|---|---|---|---|---|---|---|
| ProTrendLines | 30.45 | 31.01 | 31.51 | 31.67 | 31.82 | 33.03 | 33.70 |
| Change (%) | -3.85% | -2.08% | -0.51% | - | +0.47% | +4.29% | +6.41% |
| Change | -1.22 | -0.66 | -0.16 | - | +0.15 | +1.36 | +2.03 |
| Level | Intermediate | Minor | Major | - | Intermediate | Intermediate | Minor |
Pivot points can also be used to set your price objectives. Here is the price situation in relation to pivot points:
| Pivot points | S3 | S2 | S1 | PP | R1 | R2 | R3 |
|---|---|---|---|---|---|---|---|
| Standard | 30.00 | 30.48 | 30.80 | 31.28 | 31.60 | 32.08 | 32.40 |
| Camarilla | 30.90 | 30.97 | 31.05 | 31.12 | 31.19 | 31.27 | 31.34 |
| Woodie | 29.92 | 30.44 | 30.72 | 31.24 | 31.52 | 32.04 | 32.32 |
| Fibonacci | 30.48 | 30.79 | 30.97 | 31.28 | 31.59 | 31.77 | 32.08 |
| Pivot points | S3 | S2 | S1 | PP | R1 | R2 | R3 |
|---|---|---|---|---|---|---|---|
| Standard | 28.99 | 29.60 | 30.55 | 31.16 | 32.11 | 32.72 | 33.67 |
| Camarilla | 31.08 | 31.22 | 31.37 | 31.51 | 31.65 | 31.80 | 31.94 |
| Woodie | 29.17 | 29.69 | 30.73 | 31.25 | 32.29 | 32.81 | 33.85 |
| Fibonacci | 29.60 | 30.19 | 30.56 | 31.16 | 31.75 | 32.12 | 32.72 |
| Pivot points | S3 | S2 | S1 | PP | R1 | R2 | R3 |
|---|---|---|---|---|---|---|---|
| Standard | 21.11 | 25.46 | 27.72 | 32.07 | 34.33 | 38.68 | 40.94 |
| Camarilla | 28.15 | 28.76 | 29.36 | 29.97 | 30.58 | 31.18 | 31.79 |
| Woodie | 20.06 | 24.94 | 26.67 | 31.55 | 33.28 | 38.16 | 39.89 |
| Fibonacci | 25.46 | 27.99 | 29.55 | 32.07 | 34.60 | 36.16 | 38.68 |
Numerical data
The following is the status of the technical indicators and moving averages at the time of publication of this technical analysis:
| RSI (14): | 55.36 | |
| MACD (12,26,9): | 0.0300 | |
| Directional Movement: | 4.20 | |
| AROON (14): | 42.86 | |
| DEMA (21): | 31.57 | |
| Parabolic SAR (0,02-0,02-0,2): | 30.99 | |
| Elder Ray (13): | 0.19 | |
| Super Trend (3,10): | 31.15 | |
| Zig ZAG (10): | 31.68 | |
| VORTEX (21): | 0.8700 | |
| Stochastique (14,3,5): | 89.44 | |
| TEMA (21): | 31.51 | |
| Williams %R (14): | -16.28 | |
| Chande Momentum Oscillator (20): | -0.05 | |
| Repulse (5,40,3): | -0.0300 | |
| ROCnROLL: | 1 | |
| TRIX (15,9): | 0.0000 | |
| Courbe Coppock: | 1.42 |
| MA7: | 31.30 | |
| MA20: | 31.09 | |
| MA50: | 33.65 | |
| MA100: | 34.13 | |
| MAexp7: | 31.58 | |
| MAexp20: | 31.53 | |
| MAexp50: | 31.39 | |
| MAexp100: | 31.36 | |
| Price / MA7: | +1.18% | |
| Price / MA20: | +1.87% | |
| Price / MA50: | -5.88% | |
| Price / MA100: | -7.21% | |
| Price / MAexp7: | +0.28% | |
| Price / MAexp20: | +0.44% | |
| Price / MAexp50: | +0.89% | |
| Price / MAexp100: | +0.99% |
News
The latest news and videos published on BOUYGUES at the time of the analysis were as follows:
- Bouygues: Monthly disclosure of the total number of shares and voting rights
- Bouygues: Disclosure of trading in own shares
- Bouygues : Monthly disclosure of the total number of shares and voting rights
- Bouygues: Disclosure of trading in own shares
- Bouygues: Disclosure of trading in own shares
About author
Online


Add a comment
Comments
0 comments on the analysis BOUYGUES - 1H