BOUYGUES - Daily - Technical analysis published on 08/25/2020 (GMT)
- Who voted?
- 326
- 0
Click here for a new analysis!
- Timeframe : Daily
- - Analysis generated on
- Status : LEVEL MAINTAINED
Summary of the analysis

Additional analysis
Quotes
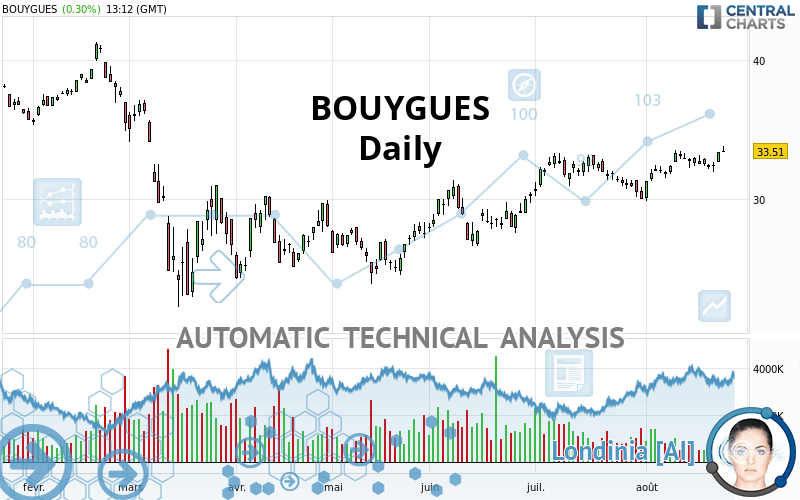
BOUYGUES rating 33.51 EUR. The price registered an increase of +0.30% on the session with the lowest point at 33.38 EUR and the highest point at 33.84 EUR. The deviation from the price is +0.39% for the low point and -0.98% for the high point.The Central Gaps scanner detects a bullish gap which is a sign that buyers have taken the lead in the very short term.
Opening Gap UP
Type : Bullish
Timeframe : Openning
So that you have an overall view of the price change, here is a table showing the variations over several periods:
Technical
Technical analysis of this Daily chart of BOUYGUES indicates that the overall trend is strongly bullish. The signals given by the moving averages are 92.86% bullish. This strong bullish trend is confirmed by the strong signals currently being given by short-term moving averages. The Central Indicators scanner does not detect any result on moving averages that would impact this trend.
Technical indicators are strongly bullish, suggesting that the price increase should continue.
Caution: the Central Indicators scanner currently detects an excess:
MACD indicator: bullish divergence
Type : Bullish
Timeframe : Daily
Williams %R indicator is overbought : over -20
Type : Neutral
Timeframe : Daily
Pivot points : price is over resistance 1
Type : Neutral
Timeframe : Weekly
MACD crosses UP its Moving Average
Type : Bullish
Timeframe : Daily
Price is back over the pivot point
Type : Bullish
Timeframe : Daily
Price is back under the pivot point
Type : Bearish
Timeframe : Weekly
Williams %R indicator is back over -50
Type : Bullish
Timeframe : Daily
The Central Patterns scanner, which studies chart patterns, resistances and supports, has identified these signals:
Near horizontal resistance
Type : Bearish
Timeframe : Daily
Near resistance of triangle
Type : Bearish
Timeframe : Daily
Resistance of channel is broken
Type : Bullish
Timeframe : Daily
The Central Candlesticks scanner, specialised in Japanese candlesticks, did not identify any signals.
| S3 | S2 | S1 | Price | R1 | R2 | R3 | |
|---|---|---|---|---|---|---|---|
| ProTrendLines | 27.05 | 30.71 | 33.25 | 33.51 | 36.28 | 39.34 | 41.20 |
| Change (%) | -19.28% | -8.36% | -0.78% | - | +8.27% | +17.40% | +22.95% |
| Change | -6.46 | -2.80 | -0.26 | - | +2.77 | +5.83 | +7.69 |
| Level | Minor | Major | Intermediate | - | Intermediate | Major | Intermediate |
To determine price objectives, it is also possible to use the pivot points. Here is the price position in relation to pivot points:
| Pivot points | S3 | S2 | S1 | PP | R1 | R2 | R3 |
|---|---|---|---|---|---|---|---|
| Standard | 32.20 | 32.46 | 32.93 | 33.19 | 33.66 | 33.92 | 34.39 |
| Camarilla | 33.21 | 33.28 | 33.34 | 33.41 | 33.48 | 33.54 | 33.61 |
| Woodie | 32.32 | 32.51 | 33.05 | 33.24 | 33.78 | 33.97 | 34.51 |
| Fibonacci | 32.46 | 32.74 | 32.91 | 33.19 | 33.47 | 33.64 | 33.92 |
| Pivot points | S3 | S2 | S1 | PP | R1 | R2 | R3 |
|---|---|---|---|---|---|---|---|
| Standard | 30.63 | 31.30 | 31.87 | 32.54 | 33.11 | 33.78 | 34.35 |
| Camarilla | 32.10 | 32.21 | 32.33 | 32.44 | 32.55 | 32.67 | 32.78 |
| Woodie | 30.58 | 31.28 | 31.82 | 32.52 | 33.06 | 33.76 | 34.30 |
| Fibonacci | 31.30 | 31.77 | 32.07 | 32.54 | 33.01 | 33.31 | 33.78 |
| Pivot points | S3 | S2 | S1 | PP | R1 | R2 | R3 |
|---|---|---|---|---|---|---|---|
| Standard | 25.51 | 27.75 | 28.88 | 31.12 | 32.25 | 34.49 | 35.62 |
| Camarilla | 29.07 | 29.38 | 29.69 | 30.00 | 30.31 | 30.62 | 30.93 |
| Woodie | 24.95 | 27.47 | 28.32 | 30.84 | 31.69 | 34.21 | 35.06 |
| Fibonacci | 27.75 | 29.04 | 29.84 | 31.12 | 32.41 | 33.21 | 34.49 |
Numerical data
The following is the status of the technical indicators and moving averages at the time of publication of this technical analysis:
| RSI (14): | 61.62 | |
| MACD (12,26,9): | 0.4800 | |
| Directional Movement: | 11.25 | |
| AROON (14): | 85.71 | |
| DEMA (21): | 33.14 | |
| Parabolic SAR (0,02-0,02-0,2): | 31.80 | |
| Elder Ray (13): | 0.87 | |
| Super Trend (3,10): | 31.43 | |
| Zig ZAG (10): | 33.56 | |
| VORTEX (21): | 1.0800 | |
| Stochastique (14,3,5): | 76.35 | |
| TEMA (21): | 33.13 | |
| Williams %R (14): | -12.93 | |
| Chande Momentum Oscillator (20): | 1.74 | |
| Repulse (5,40,3): | 1.9300 | |
| ROCnROLL: | 1 | |
| TRIX (15,9): | 0.1900 | |
| Courbe Coppock: | 9.13 |
| MA7: | 32.88 | |
| MA20: | 32.29 | |
| MA50: | 31.53 | |
| MA100: | 29.50 | |
| MAexp7: | 32.97 | |
| MAexp20: | 32.50 | |
| MAexp50: | 31.56 | |
| MAexp100: | 31.13 | |
| Price / MA7: | +1.92% | |
| Price / MA20: | +3.78% | |
| Price / MA50: | +6.28% | |
| Price / MA100: | +13.59% | |
| Price / MAexp7: | +1.64% | |
| Price / MAexp20: | +3.11% | |
| Price / MAexp50: | +6.18% | |
| Price / MAexp100: | +7.65% |
News
Don"t forget to follow the news on BOUYGUES. At the time of publication of this analysis, the latest news was as follows:
- Half-year liquidity contract statement for BOUYGUES
- BOUYGUES: Bouygues Telecom has signed an exclusivity agreement with Crédit Mutuel encompassing the acquisition of alternative telecoms operator Euro-Information Telecom and a distribution partnership
- Monthly disclosure of the total number of shares and voting right
- BOUYGUES: First-quarter 2020 results
- Monthly Disclosure of the Total Number of Shares and Voting Rights
About author

Online


Add a comment
Comments
0 comments on the analysis BOUYGUES - Daily