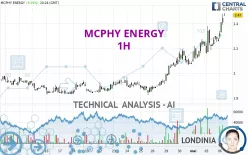
MCPHY ENERGY - 1H - Technical analysis published on 05/06/2024 (GMT)
- 199
- 0
Click here for a new analysis!
- Timeframe : 1H
- - Analysis generated on
- Status : TARGET REACHED

Summary of the analysis

Additional analysis
Quotes
The MCPHY ENERGY price is 2.470 EUR. On the day, this instrument gained +9.29% with the lowest point at 2.280 EUR and the highest point at 2.480 EUR. The deviation from the price is +8.33% for the low point and -0.40% for the high point.The Central Gaps scanner detects a bullish opening marking the presence of buyers ahead of sellers at the opening but not sufficiently marked to allow the price to register a quotation gap.
Bullish opening
Type : Bullish
Timeframe : Openning
Here is a more detailed summary of the historical variations registered by MCPHY ENERGY:
New HIGH record (1 month)
Type : Bullish
Timeframe : Weekly
Technical
Technical analysis of MCPHY ENERGY in 1H shows a strongly overall bullish trend. 92.86% of the signals given by moving averages are bullish. The overall trend is supported by the strong bullish signals from short-term moving averages. The Central Indicators scanner does not detect any result on moving averages that would impact this trend.
An assessment of technical indicators shows a strong bullish signal.
But beware of excesses. The Central Indicators scanner currently detects this:
RSI indicator is overbought : over 70
Type : Neutral
Timeframe : 1 hour
CCI indicator is overbought : over 100
Type : Neutral
Timeframe : 1 hour
Previous candle closed over Bollinger bands
Type : Neutral
Timeframe : 1 hour
Williams %R indicator is overbought : over -20
Type : Neutral
Timeframe : 1 hour
Pivot points : price is over resistance 1
Type : Neutral
Timeframe : 1 hour
Pivot points : price is over resistance 1
Type : Neutral
Timeframe : Weekly
Central Patterns, the scanner specializing in chart patterns, did not identify any signals.
The Central Candlesticks scanner currently notes the presence of this pattern in Japanese candlesticks that could mark the end of the short-term trend currently underway:
Doji
Type : Neutral
Timeframe : 1 hour
| S3 | S2 | S1 | Price | R1 | R2 | R3 | |
|---|---|---|---|---|---|---|---|
| ProTrendLines | 2.165 | 2.246 | 2.380 | 2.470 | 3.450 | 5.160 | 6.223 |
| Change (%) | -12.35% | -9.07% | -3.64% | - | +39.68% | +108.91% | +151.94% |
| Change | -0.305 | -0.224 | -0.090 | - | +0.980 | +2.690 | +3.753 |
| Level | Minor | Intermediate | Major | - | Intermediate | Minor | Intermediate |
To determine price objectives, it is also possible to use the pivot points. Here is the price position in relation to pivot points:
| Pivot points | S3 | S2 | S1 | PP | R1 | R2 | R3 |
|---|---|---|---|---|---|---|---|
| Standard | 1.925 | 2.040 | 2.150 | 2.265 | 2.375 | 2.490 | 2.600 |
| Camarilla | 2.198 | 2.219 | 2.239 | 2.260 | 2.281 | 2.301 | 2.322 |
| Woodie | 1.923 | 2.039 | 2.148 | 2.264 | 2.373 | 2.489 | 2.598 |
| Fibonacci | 2.040 | 2.126 | 2.179 | 2.265 | 2.351 | 2.404 | 2.490 |
| Pivot points | S3 | S2 | S1 | PP | R1 | R2 | R3 |
|---|---|---|---|---|---|---|---|
| Standard | 1.557 | 1.745 | 2.003 | 2.191 | 2.449 | 2.637 | 2.895 |
| Camarilla | 2.137 | 2.178 | 2.219 | 2.260 | 2.301 | 2.342 | 2.383 |
| Woodie | 1.591 | 1.763 | 2.037 | 2.209 | 2.483 | 2.655 | 2.929 |
| Fibonacci | 1.745 | 1.916 | 2.021 | 2.191 | 2.362 | 2.467 | 2.637 |
| Pivot points | S3 | S2 | S1 | PP | R1 | R2 | R3 |
|---|---|---|---|---|---|---|---|
| Standard | 1.270 | 1.540 | 1.810 | 2.080 | 2.350 | 2.620 | 2.890 |
| Camarilla | 1.932 | 1.981 | 2.031 | 2.080 | 2.130 | 2.179 | 2.229 |
| Woodie | 1.270 | 1.540 | 1.810 | 2.080 | 2.350 | 2.620 | 2.890 |
| Fibonacci | 1.540 | 1.746 | 1.874 | 2.080 | 2.286 | 2.414 | 2.620 |
Numerical data
The following is the status of the technical indicators and moving averages at the time of publication of this technical analysis:
| RSI (14): | 70.18 | |
| MACD (12,26,9): | 0.0800 | |
| Directional Movement: | 33.214 | |
| AROON (14): | 78.571 | |
| DEMA (21): | 2.380 | |
| Parabolic SAR (0,02-0,02-0,2): | 2.302 | |
| Elder Ray (13): | 0.147 | |
| Super Trend (3,10): | 2.279 | |
| Zig ZAG (10): | 2.470 | |
| VORTEX (21): | 1.1960 | |
| Stochastique (14,3,5): | 94.36 | |
| TEMA (21): | 2.410 | |
| Williams %R (14): | 0.00 | |
| Chande Momentum Oscillator (20): | 0.315 | |
| Repulse (5,40,3): | 4.1210 | |
| ROCnROLL: | 1 | |
| TRIX (15,9): | 0.4270 | |
| Courbe Coppock: | 13.48 |
| MA7: | 2.135 | |
| MA20: | 1.992 | |
| MA50: | 1.929 | |
| MA100: | 2.431 | |
| MAexp7: | 2.377 | |
| MAexp20: | 2.260 | |
| MAexp50: | 2.149 | |
| MAexp100: | 2.057 | |
| Price / MA7: | +15.69% | |
| Price / MA20: | +24.00% | |
| Price / MA50: | +28.05% | |
| Price / MA100: | +1.60% | |
| Price / MAexp7: | +3.91% | |
| Price / MAexp20: | +9.29% | |
| Price / MAexp50: | +14.94% | |
| Price / MAexp100: | +20.08% |
News
The last news published on MCPHY ENERGY at the time of the generation of this analysis was as follows:
- McPhy 2023 Universal Registration Document and new 2024 financial agenda are available
- McPhy Energy: Combined shareholders’ general meeting of May 30, 2024: Terms of availability of the preparatory documents
- McPhy Energy: Proposed transfer of the listing of McPhy shares on Euronext Growth Paris
- McPhy Energy: Monthly information relating to the total number of voting rights and outstanding shares (February 29, 2024)
- McPhy Energy: McPhy awarded a new firm contract in the industrial field for the supply of a McLyzer 800 to AAK in Sweden
About author
Online


Add a comment
Comments
0 comments on the analysis MCPHY ENERGY - 1H