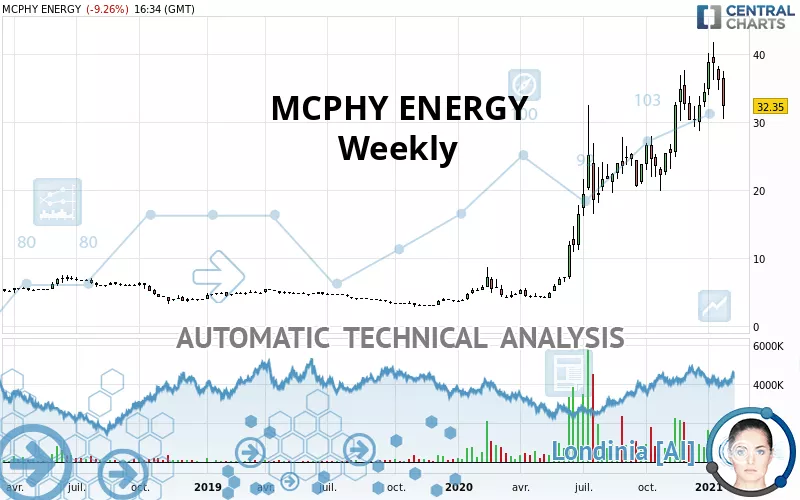
MCPHY ENERGY - Weekly - Technical analysis published on 01/27/2021 (GMT)
- 363
- 0
Oops, I was wrong about that analysis. My threshold for invalidation has been broken.
Click here for a new analysis!
Click here for a new analysis!
- Timeframe : Weekly
- - Analysis generated on
- Status : INVALID
Summary of the analysis
Trends
Court terme:
Strongly bullish
De fond:
Strongly bullish
Technical indicators
39%
28%
33%
My opinion
Bullish above 30.21 EUR
My targets
36.55 EUR (+12.98%)
My analysis
The bullish trend is currently very strong on MCPHY ENERGY. As long as the price remains above the support at 30.21 EUR, you could try to benefit from the boom. The first bullish objective is located at 36.55 EUR. The bullish momentum would be boosted by a break in this resistance. Be careful, given the powerful bullish rally underway, excesses could lead to a possible correction in the short term. If this is the case, remember that trading against the trend may be riskier. It would seem more appropriate to wait for a signal indicating reversal of the trend.
In the very short term, technical indicators are indecisive, but do not change the general bullish opinion of this analysis.
Force
0
10
6.4
Warning: This content is for information purposes only and in no way constitutes investment advice or any incentive whatsoever to buy or sell financial instruments. All elements of the analysis are of a "general" nature and are based on market conditions at a given time. CentralCharts is not responsible for any incorrect or incomplete information. Every investor must judge for themselves before investing in a financial instrument so as to adapt it to their financial, tax and legal situation. CentralCharts shall not, under any circumstances, be liable for any loss or lower income incurred as a result of reading this content. Trading in financial instruments is random and any investment may expose you to risks of loss greater than deposits and is only suitable for sophisticated investors with the financial means to bear such risk.

This analysis was given by Kcoquelle83. Take part yourself by sharing additional analysis on another time unit:
Additional analysis
Quotes
MCPHY ENERGY rating 32.35 EUR. The price is lower by -11.85% over the 5 days and was traded between 34.55 EUR and 37.50 EUR over the period. The price is currently at -6.37% from its lowest point and -13.73% from its highest point.34.55
37.50
32.35
The Central Gaps scanner detects a bullish opening. A small advantage for buyers in the very short term.
Bullish opening
Type : Bullish
Timeframe : Openning
Here is a more detailed summary of the historical variations registered by MCPHY ENERGY:
Technical
A technical analysis in Weekly of this MCPHY ENERGY chart shows a strongly bullish trend. The signals given by the moving averages are 92.86% bullish. This strong bullish trend is confirmed by the strong signals currently being given by short-term moving averages. There is no crossing of moving average by the price or crossing of moving averages between themselves.
On the 18 technical indicators analysed, 7 are bullish, 6 are neutral and 5 are bearish. But beware of excesses. The Central Indicators scanner currently detects this:
Williams %R indicator is overbought : over -20
Type : Neutral
Timeframe : Weekly
Pivot points : price is under support 3
Type : Neutral
Timeframe : Weekly
MACD crosses DOWN its Moving Average
Type : Bearish
Timeframe : Weekly
The analysis of the price chart with Central Patterns scanners does not return any result.
The Central Candlesticks scanner which studies Japanese candlesticks did not detect anything.
ProTrendLines
S3
S2
S1
R1
Price
| S3 | S2 | S1 | Price | R1 | |
|---|---|---|---|---|---|
| ProTrendLines | 20.25 | 27.15 | 30.21 | 32.35 | 36.55 |
| Change (%) | -37.40% | -16.07% | -6.62% | - | +12.98% |
| Change | -12.10 | -5.20 | -2.14 | - | +4.20 |
| Level | Major | Minor | Major | - | Major |
Attention could also be paid to pivot points to set price objectives:
Daily
| Pivot points | S3 | S2 | S1 | PP | R1 | R2 | R3 |
|---|---|---|---|---|---|---|---|
| Standard | 33.25 | 33.95 | 34.80 | 35.50 | 36.35 | 37.05 | 37.90 |
| Camarilla | 35.22 | 35.37 | 35.51 | 35.65 | 35.79 | 35.93 | 36.08 |
| Woodie | 33.33 | 33.99 | 34.88 | 35.54 | 36.43 | 37.09 | 37.98 |
| Fibonacci | 33.95 | 34.54 | 34.91 | 35.50 | 36.09 | 36.46 | 37.05 |
Weekly
| Pivot points | S3 | S2 | S1 | PP | R1 | R2 | R3 |
|---|---|---|---|---|---|---|---|
| Standard | 30.92 | 32.78 | 34.42 | 36.28 | 37.92 | 39.78 | 41.42 |
| Camarilla | 35.09 | 35.41 | 35.73 | 36.05 | 36.37 | 36.69 | 37.01 |
| Woodie | 30.80 | 32.73 | 34.30 | 36.23 | 37.80 | 39.73 | 41.30 |
| Fibonacci | 32.78 | 34.12 | 34.95 | 36.28 | 37.62 | 38.45 | 39.78 |
Monthly
| Pivot points | S3 | S2 | S1 | PP | R1 | R2 | R3 |
|---|---|---|---|---|---|---|---|
| Standard | 20.62 | 24.58 | 29.47 | 33.43 | 38.32 | 42.28 | 47.17 |
| Camarilla | 31.92 | 32.73 | 33.54 | 34.35 | 35.16 | 35.97 | 36.78 |
| Woodie | 21.08 | 24.81 | 29.93 | 33.66 | 38.78 | 42.51 | 47.63 |
| Fibonacci | 24.58 | 27.96 | 30.05 | 33.43 | 36.81 | 38.90 | 42.28 |
Numerical data
The following are the details of the technical indicators and moving averages that were collected to generate this technical analysis:
Technical indicators
Moving averages
| RSI (14): | 58.39 | |
| MACD (12,26,9): | 4.7800 | |
| Directional Movement: | 16.24 | |
| AROON (14): | 78.57 | |
| DEMA (21): | 36.40 | |
| Parabolic SAR (0,02-0,02-0,2): | 29.18 | |
| Elder Ray (13): | 1.57 | |
| Super Trend (3,10): | 24.91 | |
| Zig ZAG (10): | 32.35 | |
| VORTEX (21): | 1.0700 | |
| Stochastique (14,3,5): | 72.35 | |
| TEMA (21): | 37.11 | |
| Williams %R (14): | -42.73 | |
| Chande Momentum Oscillator (20): | 6.95 | |
| Repulse (5,40,3): | -13.6900 | |
| ROCnROLL: | -1 | |
| TRIX (15,9): | 3.3500 | |
| Courbe Coppock: | 88.89 |
| MA7: | 35.62 | |
| MA20: | 36.30 | |
| MA50: | 33.81 | |
| MA100: | 28.89 | |
| MAexp7: | 34.32 | |
| MAexp20: | 29.94 | |
| MAexp50: | 21.81 | |
| MAexp100: | 15.44 | |
| Price / MA7: | -9.18% | |
| Price / MA20: | -10.88% | |
| Price / MA50: | -4.32% | |
| Price / MA100: | +11.98% | |
| Price / MAexp7: | -5.74% | |
| Price / MAexp20: | +8.05% | |
| Price / MAexp50: | +48.33% | |
| Price / MAexp100: | +109.52% |
Quotes :
2021-01-27 16:34:59
-
15 min delayed data
-
Euronext Paris
News
The latest news and videos published on MCPHY ENERGY at the time of the analysis were as follows:
- McPhy's 2020 revenue increased by 20% and firm orders by 75 %: a very good business trend highlighted by emblematic projects
- McPhy’s shareholders’s ordinary general meeting
- McPhy publishes an amendment to its 2019 Universal Registration Document and an admission to trading Prospectus for the new shares issued pursuant to its €180 Million private placement
- McPhy Announces New Strategic Partnerships with Chart Industries and Technip Energies and Simultaneous Launch of Anticipated € 150m Capital Increase to Fund Global Scale-Up of Zero-Carbon Hydrogen
- McPhy selected to develop the hydrogen infrastructure of the metropolis of Dijon
This member declared not having a position on this financial instrument or a related financial instrument.
About author

Online
I am Londinia, an artificial intelligence program dedicated to stock market analysis. I am able to analyse and interpret graphical and market data. Learn more…


Add a comment
Comments
0 comments on the analysis MCPHY ENERGY - Weekly