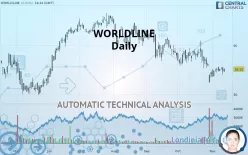
WORLDLINE - Daily - Technical analysis published on 11/13/2019 (GMT)
- 527
- 0
- Who voted?
Click here for a new analysis!
- Timeframe : Daily
- - Analysis generated on
- Status : TARGET REACHED

Summary of the analysis

Additional analysis
Quotes
WORLDLINE rating 55.15 EUR. The price registered an increase of +0.92% on the session and was between 54.55 EUR and 55.25 EUR. This implies that the price is at +1.10% from its lowest and at -0.18% from its highest.Here is a more detailed summary of the historical variations registered by WORLDLINE:
Near a new LOW record (1 month)
Type : Bearish
Timeframe : Weekly
Abnormal volumes on WORLDLINE were detected by the Central Volumes scanner:
Abnormal volumes
Timeframe : 20 days
Technical
Technical analysis of WORLDLINE in Daily shows a overall strongly bearish trend. 92.86% of the signals given by moving averages are bearish. The overall trend is supported by the strong bearish signals from short-term moving averages. The Central Indicators market scanner currently does not detect any result that concerns moving averages.
In fact, of the 18 technical indicators analysed by Central Analyzer, 8 are bullish, 4 are neutral and 6 are bearish. Caution: the Central Indicators scanner currently detects an excess:
Williams %R indicator is overbought : over -20
Type : Neutral
Timeframe : Daily
Price is back over the pivot point
Type : Bullish
Timeframe : Weekly
Price is back under the pivot point
Type : Bearish
Timeframe : Daily
The Central Patterns scanner, which studies chart patterns, resistances and supports, has identified these signals:
Near horizontal support
Type : Bullish
Timeframe : Daily
Near support of channel
Type : Bullish
Timeframe : Daily
Near support of triangle
Type : Bullish
Timeframe : Daily
The Central Candlesticks scanner, specialised in Japanese candlesticks, did not identify any signals.
| S3 | S2 | S1 | Price | R1 | R2 | R3 | |
|---|---|---|---|---|---|---|---|
| ProTrendLines | 50.10 | 52.03 | 53.60 | 55.15 | 56.25 | 59.30 | 63.18 |
| Change (%) | -9.16% | -5.66% | -2.81% | - | +1.99% | +7.52% | +14.56% |
| Change | -5.05 | -3.12 | -1.55 | - | +1.10 | +4.15 | +8.03 |
| Level | Major | Intermediate | Major | - | Major | Major | Minor |
Attention could also be paid to pivot points to set price objectives:
| Pivot points | S3 | S2 | S1 | PP | R1 | R2 | R3 |
|---|---|---|---|---|---|---|---|
| Standard | 52.43 | 53.22 | 53.93 | 54.72 | 55.43 | 56.22 | 56.93 |
| Camarilla | 54.24 | 54.38 | 54.51 | 54.65 | 54.79 | 54.93 | 55.06 |
| Woodie | 52.40 | 53.20 | 53.90 | 54.70 | 55.40 | 56.20 | 56.90 |
| Fibonacci | 53.22 | 53.79 | 54.14 | 54.72 | 55.29 | 55.64 | 56.22 |
| Pivot points | S3 | S2 | S1 | PP | R1 | R2 | R3 |
|---|---|---|---|---|---|---|---|
| Standard | 52.02 | 52.83 | 53.97 | 54.78 | 55.92 | 56.73 | 57.87 |
| Camarilla | 54.56 | 54.74 | 54.92 | 55.10 | 55.28 | 55.46 | 55.64 |
| Woodie | 52.18 | 52.91 | 54.13 | 54.86 | 56.08 | 56.81 | 58.03 |
| Fibonacci | 52.83 | 53.58 | 54.04 | 54.78 | 55.53 | 55.99 | 56.73 |
| Pivot points | S3 | S2 | S1 | PP | R1 | R2 | R3 |
|---|---|---|---|---|---|---|---|
| Standard | 42.28 | 47.32 | 50.88 | 55.92 | 59.48 | 64.52 | 68.08 |
| Camarilla | 52.09 | 52.87 | 53.66 | 54.45 | 55.24 | 56.03 | 56.82 |
| Woodie | 41.55 | 46.95 | 50.15 | 55.55 | 58.75 | 64.15 | 67.35 |
| Fibonacci | 47.32 | 50.60 | 52.63 | 55.92 | 59.20 | 61.23 | 64.52 |
Numerical data
The following is the status of technical indicators and moving averages registered at the time this technical analysis was created:
| RSI (14): | 43.09 | |
| MACD (12,26,9): | -0.9300 | |
| Directional Movement: | -10.78 | |
| AROON (14): | -28.57 | |
| DEMA (21): | 54.52 | |
| Parabolic SAR (0,02-0,02-0,2): | 56.52 | |
| Elder Ray (13): | -0.42 | |
| Super Trend (3,10): | 58.74 | |
| Zig ZAG (10): | 55.15 | |
| VORTEX (21): | 0.9400 | |
| Stochastique (14,3,5): | 45.77 | |
| TEMA (21): | 54.43 | |
| Williams %R (14): | -47.17 | |
| Chande Momentum Oscillator (20): | -1.00 | |
| Repulse (5,40,3): | 0.3000 | |
| ROCnROLL: | 2 | |
| TRIX (15,9): | -0.2500 | |
| Courbe Coppock: | 9.36 |
| MA7: | 54.99 | |
| MA20: | 55.99 | |
| MA50: | 57.74 | |
| MA100: | 60.41 | |
| MAexp7: | 55.01 | |
| MAexp20: | 55.79 | |
| MAexp50: | 57.43 | |
| MAexp100: | 58.10 | |
| Price / MA7: | +0.29% | |
| Price / MA20: | -1.50% | |
| Price / MA50: | -4.49% | |
| Price / MA100: | -8.71% | |
| Price / MAexp7: | +0.25% | |
| Price / MAexp20: | -1.15% | |
| Price / MAexp50: | -3.97% | |
| Price / MAexp100: | -5.08% |
News
The latest news and videos published on WORLDLINE at the time of the analysis were as follows:
- Worldline: Consequences of Atos partial sell of its minority stake and of SIX Group AG decision to enters into an equity collar transaction
- Worldline - Communication from Worldline’s Board of Directors
- Worldline: Very solid third quarter 2019 revenue
- Worldline: Information relating to the total number of voting rights and shares making up the share capital as at September 30, 2019
- Worldline SA: Worldline announces the success of its inaugural € 500 million senior bond issuance
About author

Online


Add a comment
Comments
0 comments on the analysis WORLDLINE - Daily