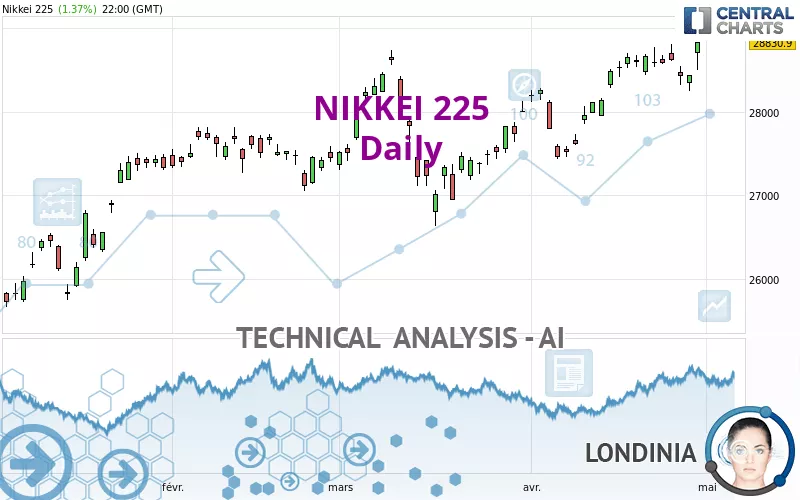
NIKKEI 225 - Daily - Technical analysis published on 05/20/2024 (GMT)
- 166
- 0
Click here for a new analysis!
- Timeframe : Daily
- - Analysis generated on
- Status : LEVEL MAINTAINED
Summary of the analysis

Additional analysis
Quotes
The NIKKEI 225 rating is 38,714.01 JPY. On the day, this instrument lost -0.38% and was traded between 38,539.56 JPY and 38,842.49 JPY over the period. The price is currently at +0.45% from its lowest and -0.33% from its highest.So that you have an overall view of the price change, here is a table showing the variations over several periods:
Near a new LOW record (1 month)
Type : Bearish
Timeframe : Weekly
Technical
Technical analysis of NIKKEI 225 in Daily shows an overall bullish trend. 71.43% of the signals given by moving averages are bullish. The overall trend seems to be showing some signs of weakness, as do the tentative bullish signals given by short-term moving averages. An assessment of moving averages reveals several bullish signals that could impact this trend:
Bullish price crossover with adaptative moving average 20
Type : Bullish
Timeframe : Daily
Bullish price crossover with adaptative moving average 100
Type : Bullish
Timeframe : Daily
Technical indicators are strongly bullish, suggesting that the price increase should continue.
Caution: the Central Indicators scanner currently detects an excess:
CCI indicator is overbought : over 100
Type : Neutral
Timeframe : Daily
Williams %R indicator is overbought : over -20
Type : Neutral
Timeframe : Daily
Pivot points : price is over resistance 1
Type : Neutral
Timeframe : Daily
Pivot points : price is over resistance 1
Type : Neutral
Timeframe : Weekly
RSI indicator is back over 50
Type : Bullish
Timeframe : Daily
Momentum indicator is back over 0
Type : Bullish
Timeframe : Daily
The analysis of the price chart with Central Patterns scanners does not return any result.
The Central Candlesticks scanner, specialised in Japanese candlesticks, did not identify any signals.
| S3 | S2 | S1 | Price | R1 | R2 | R3 | |
|---|---|---|---|---|---|---|---|
| ProTrendLines | 30,589.60 | 33,687.80 | 37,203.69 | 38,714.01 | 38,729.25 | 40,109.23 | 40,888.43 |
| Change (%) | -20.99% | -12.98% | -3.90% | - | +0.04% | +3.60% | +5.62% |
| Change | -8,124.41 | -5,026.21 | -1,510.32 | - | +15.24 | +1,395.22 | +2,174.42 |
| Level | Major | Intermediate | Minor | - | Intermediate | Minor | Major |
Pivot points can also be used to set your price objectives. Here is the price situation in relation to pivot points:
| Pivot points | S3 | S2 | S1 | PP | R1 | R2 | R3 |
|---|---|---|---|---|---|---|---|
| Standard | 38,251.95 | 38,395.76 | 38,554.88 | 38,698.69 | 38,857.81 | 39,001.62 | 39,160.74 |
| Camarilla | 38,630.70 | 38,658.47 | 38,686.24 | 38,714.01 | 38,741.78 | 38,769.55 | 38,797.32 |
| Woodie | 38,259.62 | 38,399.59 | 38,562.55 | 38,702.52 | 38,865.48 | 39,005.45 | 39,168.41 |
| Fibonacci | 38,395.76 | 38,511.48 | 38,582.97 | 38,698.69 | 38,814.41 | 38,885.90 | 39,001.62 |
| Pivot points | S3 | S2 | S1 | PP | R1 | R2 | R3 |
|---|---|---|---|---|---|---|---|
| Standard | 37,228.60 | 37,599.09 | 38,156.55 | 38,527.04 | 39,084.50 | 39,454.99 | 40,012.45 |
| Camarilla | 38,458.82 | 38,543.89 | 38,628.95 | 38,714.01 | 38,799.07 | 38,884.13 | 38,969.20 |
| Woodie | 37,322.09 | 37,645.83 | 38,250.04 | 38,573.78 | 39,177.99 | 39,501.73 | 40,105.94 |
| Fibonacci | 37,599.09 | 37,953.57 | 38,172.56 | 38,527.04 | 38,881.52 | 39,100.51 | 39,454.99 |
| Pivot points | S3 | S2 | S1 | PP | R1 | R2 | R3 |
|---|---|---|---|---|---|---|---|
| Standard | 32,421.49 | 34,577.27 | 36,385.65 | 38,541.43 | 40,349.81 | 42,505.59 | 44,313.97 |
| Camarilla | 37,103.88 | 37,467.26 | 37,830.64 | 38,194.02 | 38,557.40 | 38,920.78 | 39,284.16 |
| Woodie | 32,247.78 | 34,490.42 | 36,211.94 | 38,454.58 | 40,176.10 | 42,418.74 | 44,140.26 |
| Fibonacci | 34,577.27 | 36,091.58 | 37,027.12 | 38,541.43 | 40,055.74 | 40,991.28 | 42,505.59 |
Numerical data
The following are the details of the technical indicators and moving averages that were collected to generate this technical analysis:
| RSI (14): | 54.80 | |
| MACD (12,26,9): | -126.9600 | |
| Directional Movement: | 4.13 | |
| AROON (14): | 100.00 | |
| DEMA (21): | 38,216.60 | |
| Parabolic SAR (0,02-0,02-0,2): | 37,013.96 | |
| Elder Ray (13): | 333.60 | |
| Super Trend (3,10): | 39,209.69 | |
| Zig ZAG (10): | 38,859.87 | |
| VORTEX (21): | 0.7800 | |
| Stochastique (14,3,5): | 77.36 | |
| TEMA (21): | 38,176.74 | |
| Williams %R (14): | -2.80 | |
| Chande Momentum Oscillator (20): | 1,210.56 | |
| Repulse (5,40,3): | -0.0600 | |
| ROCnROLL: | 1 | |
| TRIX (15,9): | -0.1000 | |
| Courbe Coppock: | 2.42 |
| MA7: | 38,333.55 | |
| MA20: | 38,139.69 | |
| MA50: | 39,086.93 | |
| MA100: | 37,519.40 | |
| MAexp7: | 38,420.43 | |
| MAexp20: | 38,434.25 | |
| MAexp50: | 38,426.31 | |
| MAexp100: | 37,462.16 | |
| Price / MA7: | +0.99% | |
| Price / MA20: | +1.51% | |
| Price / MA50: | -0.95% | |
| Price / MA100: | +3.18% | |
| Price / MAexp7: | +0.76% | |
| Price / MAexp20: | +0.73% | |
| Price / MAexp50: | +0.75% | |
| Price / MAexp100: | +3.34% |
News
The last news published on NIKKEI 225 at the time of the generation of this analysis was as follows:
-
 Trade of the week: short Nikkei 225
-
Nikkei close to record high, but wait for another retracement first
-
Nikkei 225 Forecast January 25, 2023
-
Nikkei 225 Forecast January 4, 2023
-
Nikkei 225 Forecast September 28, 2022
About author

Online


Add a comment
Comments
0 comments on the analysis NIKKEI 225 - Daily