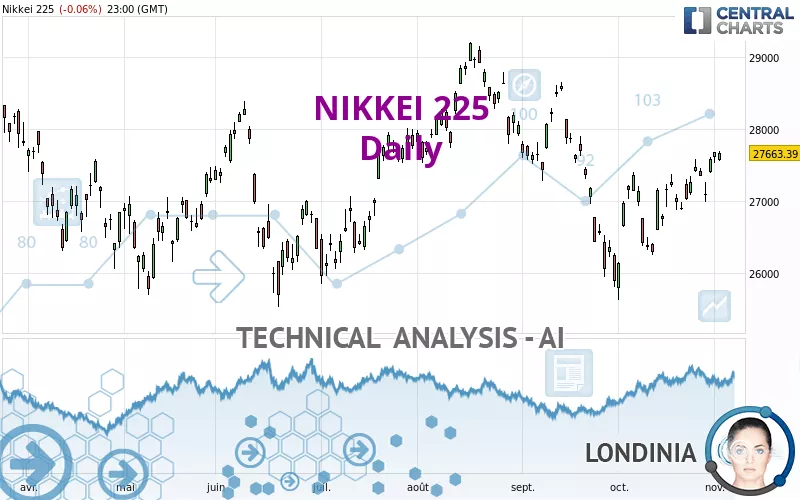
NIKKEI 225 - Daily - Technical analysis published on 11/02/2022 (GMT)
- 245
- 0
Click here for a new analysis!
- Timeframe : Daily
- - Analysis generated on
- Status : TARGET REACHED
Summary of the analysis

Additional analysis
Quotes
The NIKKEI 225 price is 27,663.40 JPY. On the day, this instrument lost -0.06% and was between 27,546.90 JPY and 27,692.60 JPY. This implies that the price is at +0.42% from its lowest and at -0.11% from its highest.The Central Gaps scanner detects a bullish gap which is a sign that buyers have taken the lead in the very short term.
Opening Gap UP
Type : Bullish
Timeframe : Openning
A study of price movements over other periods shows the following variations:
New HIGH record (1 month)
Type : Bullish
Timeframe : Weekly
Technical
A technical analysis in Daily of this NIKKEI 225 chart shows a slightly bullish trend. Only 57.14% of the signals given by moving averages are bullish. This slightly bullish trend is reinforced by the strong signals currently being given by short-term moving averages. The Central Indicators market scanner currently does not detect any result that concerns moving averages.
The probability of a further increase is high given the direction of the technical indicators.
Caution: the Central Indicators scanner currently detects an excess:
CCI indicator is overbought : over 100
Type : Neutral
Timeframe : Daily
Williams %R indicator is overbought : over -20
Type : Neutral
Timeframe : Daily
Pivot points : price is over resistance 1
Type : Neutral
Timeframe : Daily
Pivot points : price is over resistance 1
Type : Neutral
Timeframe : Weekly
The analysis of the price chart with Central Patterns scanners does not return any result.
The Central Candlesticks scanner which studies Japanese candlesticks did not detect anything.
| S3 | S2 | S1 | Price | R1 | R2 | R3 | |
|---|---|---|---|---|---|---|---|
| ProTrendLines | 25,696.60 | 26,327.20 | 26,878.50 | 27,663.40 | 27,683.60 | 28,281.70 | 29,207.10 |
| Change (%) | -7.11% | -4.83% | -2.84% | - | +0.07% | +2.24% | +5.58% |
| Change | -1,966.80 | -1,336.20 | -784.90 | - | +20.20 | +618.30 | +1,543.70 |
| Level | Major | Minor | Intermediate | - | Minor | Intermediate | Intermediate |
To determine price objectives, it is also possible to use the pivot points. Here is the price position in relation to pivot points:
| Pivot points | S3 | S2 | S1 | PP | R1 | R2 | R3 |
|---|---|---|---|---|---|---|---|
| Standard | 27,430.30 | 27,488.60 | 27,576.00 | 27,634.30 | 27,721.70 | 27,780.00 | 27,867.40 |
| Camarilla | 27,623.33 | 27,636.69 | 27,650.04 | 27,663.40 | 27,676.76 | 27,690.11 | 27,703.47 |
| Woodie | 27,444.85 | 27,495.88 | 27,590.55 | 27,641.58 | 27,736.25 | 27,787.28 | 27,881.95 |
| Fibonacci | 27,488.60 | 27,544.26 | 27,578.64 | 27,634.30 | 27,689.96 | 27,724.34 | 27,780.00 |
| Pivot points | S3 | S2 | S1 | PP | R1 | R2 | R3 |
|---|---|---|---|---|---|---|---|
| Standard | 26,256.35 | 26,618.72 | 26,853.32 | 27,215.69 | 27,450.29 | 27,812.66 | 28,047.26 |
| Camarilla | 26,923.76 | 26,978.49 | 27,033.21 | 27,087.93 | 27,142.65 | 27,197.38 | 27,252.10 |
| Woodie | 26,192.48 | 26,586.78 | 26,789.45 | 27,183.75 | 27,386.42 | 27,780.72 | 27,983.39 |
| Fibonacci | 26,618.72 | 26,846.76 | 26,987.64 | 27,215.69 | 27,443.73 | 27,584.61 | 27,812.66 |
| Pivot points | S3 | S2 | S1 | PP | R1 | R2 | R3 |
|---|---|---|---|---|---|---|---|
| Standard | 24,290.92 | 24,956.44 | 26,271.95 | 26,937.47 | 28,252.98 | 28,918.50 | 30,234.01 |
| Camarilla | 27,042.68 | 27,224.27 | 27,405.87 | 27,587.46 | 27,769.05 | 27,950.65 | 28,132.24 |
| Woodie | 24,615.92 | 25,118.94 | 26,596.95 | 27,099.97 | 28,577.98 | 29,081.00 | 30,559.01 |
| Fibonacci | 24,956.44 | 25,713.19 | 26,180.72 | 26,937.47 | 27,694.22 | 28,161.75 | 28,918.50 |
Numerical data
The following is the status of technical indicators and moving averages registered at the time this technical analysis was created:
| RSI (14): | 56.81 | |
| MACD (12,26,9): | 67.5400 | |
| Directional Movement: | 8.31 | |
| AROON (14): | 92.86 | |
| DEMA (21): | 27,201.68 | |
| Parabolic SAR (0,02-0,02-0,2): | 26,658.90 | |
| Elder Ray (13): | 366.23 | |
| Super Trend (3,10): | 26,535.38 | |
| Zig ZAG (10): | 27,678.90 | |
| VORTEX (21): | 0.9500 | |
| Stochastique (14,3,5): | 87.27 | |
| TEMA (21): | 27,413.17 | |
| Williams %R (14): | -0.29 | |
| Chande Momentum Oscillator (20): | 533.42 | |
| Repulse (5,40,3): | 0.9200 | |
| ROCnROLL: | 1 | |
| TRIX (15,9): | -0.0300 | |
| Courbe Coppock: | 4.69 |
| MA7: | 27,352.33 | |
| MA20: | 27,070.96 | |
| MA50: | 27,432.04 | |
| MA100: | 27,337.09 | |
| MAexp7: | 27,376.69 | |
| MAexp20: | 27,183.34 | |
| MAexp50: | 27,272.14 | |
| MAexp100: | 27,347.36 | |
| Price / MA7: | +1.14% | |
| Price / MA20: | +2.19% | |
| Price / MA50: | +0.84% | |
| Price / MA100: | +1.19% | |
| Price / MAexp7: | +1.05% | |
| Price / MAexp20: | +1.77% | |
| Price / MAexp50: | +1.43% | |
| Price / MAexp100: | +1.16% |
News
The latest news and videos published on NIKKEI 225 at the time of the analysis were as follows:
-
 Nikkei 225 Forecast September 28, 2022
-
DAX and Nikkei 225 Forecast July 13, 2022
-
DAX and Nikkei 225 Forecast June 28, 2022
-
DAX and Nikkei 225 Forecast June 24, 2022
-
DAX and Nikkei 225 Forecast June 10, 2022
About author
Online


Add a comment
Comments
0 comments on the analysis NIKKEI 225 - Daily