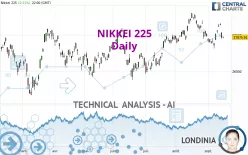
NIKKEI 225 - Daily - Technical analysis published on 09/15/2022 (GMT)
- 145
- 0
Click here for a new analysis!
- Timeframe : Daily
- - Analysis generated on
- Status : INVALID

Summary of the analysis

Additional analysis
Quotes
The NIKKEI 225 price is 27,860.40 JPY. The price is lower by -0.02% since the last closing and was traded between 27,801.40 JPY and 27,946.20 JPY over the period. The price is currently at +0.21% from its lowest and -0.31% from its highest.The Central Gaps scanner detects a bearish gap which is a sign that the sellers have taken the lead in the very short term.
Opening Gap DOWN
Type : Bearish
Timeframe : Openning
So that you have an overall view of the price change, here is a table showing the variations over several periods:
Near a new HIGH record (1st january)
Type : Bullish
Timeframe : Weekly
Near a new HIGH record (1 month)
Type : Bullish
Timeframe : Weekly
Technical
Technical analysis of this Daily chart of NIKKEI 225 indicates that the overall trend is bullish. 71.43% of the signals given by moving averages are bullish. Caution: the neutral signals currently given by the short-term moving averages indicate that this bullish trend is showing signs of running out of steam. The Central Indicators market scanner is currently detecting several bearish signals that could impact this trend:
Bearish price crossover with Moving Average 20
Type : Bearish
Timeframe : Daily
Bearish price crossover with adaptative moving average 20
Type : Bearish
Timeframe : Daily
On the 18 technical indicators analysed, 5 are bullish, 7 are neutral and 6 are bearish. But beware of excesses. The Central Indicators scanner currently detects this:
MACD indicator: bearish divergence
Type : Bearish
Timeframe : Daily
RSI indicator: bearish divergence
Type : Bearish
Timeframe : Daily
Pivot points : price is under support 3
Type : Neutral
Timeframe : Daily
RSI indicator is back under 50
Type : Bearish
Timeframe : Daily
MACD crosses DOWN its Moving Average
Type : Bearish
Timeframe : Daily
Price is back under the pivot point
Type : Bearish
Timeframe : Weekly
Williams %R indicator is back under -50
Type : Bearish
Timeframe : Daily
The analysis of the price chart with Central Patterns scanners does not return any result.
The Central Candlesticks scanner, specialised in Japanese candlesticks, did not identify any signals.
| S3 | S2 | S1 | Price | R1 | R2 | R3 | |
|---|---|---|---|---|---|---|---|
| ProTrendLines | 25,704.30 | 26,358.80 | 27,571.80 | 27,860.40 | 28,247.80 | 28,640.80 | 29,332.20 |
| Change (%) | -7.74% | -5.39% | -1.04% | - | +1.39% | +2.80% | +5.28% |
| Change | -2,156.10 | -1,501.60 | -288.60 | - | +387.40 | +780.40 | +1,471.80 |
| Level | Major | Minor | Intermediate | - | Major | Minor | Intermediate |
To determine price objectives, it is also possible to use the pivot points. Here is the price position in relation to pivot points:
| Pivot points | S3 | S2 | S1 | PP | R1 | R2 | R3 |
|---|---|---|---|---|---|---|---|
| Standard | 27,647.67 | 27,724.53 | 27,792.47 | 27,869.33 | 27,937.27 | 28,014.13 | 28,082.07 |
| Camarilla | 27,820.58 | 27,833.85 | 27,847.13 | 27,860.40 | 27,873.67 | 27,886.95 | 27,900.22 |
| Woodie | 27,643.20 | 27,722.30 | 27,788.00 | 27,867.10 | 27,932.80 | 28,011.90 | 28,077.60 |
| Fibonacci | 27,724.53 | 27,779.85 | 27,814.02 | 27,869.33 | 27,924.65 | 27,958.82 | 28,014.13 |
| Pivot points | S3 | S2 | S1 | PP | R1 | R2 | R3 |
|---|---|---|---|---|---|---|---|
| Standard | 26,561.04 | 26,914.87 | 27,578.36 | 27,932.19 | 28,595.68 | 28,949.51 | 29,613.00 |
| Camarilla | 27,962.09 | 28,055.34 | 28,148.60 | 28,241.85 | 28,335.10 | 28,428.36 | 28,521.61 |
| Woodie | 26,715.87 | 26,992.29 | 27,733.19 | 28,009.61 | 28,750.51 | 29,026.93 | 29,767.83 |
| Fibonacci | 26,914.87 | 27,303.49 | 27,543.57 | 27,932.19 | 28,320.81 | 28,560.89 | 28,949.51 |
| Pivot points | S3 | S2 | S1 | PP | R1 | R2 | R3 |
|---|---|---|---|---|---|---|---|
| Standard | 25,643.75 | 26,587.17 | 27,323.67 | 28,267.09 | 29,003.59 | 29,947.01 | 30,683.51 |
| Camarilla | 27,598.18 | 27,752.18 | 27,906.17 | 28,060.16 | 28,214.15 | 28,368.15 | 28,522.14 |
| Woodie | 25,540.28 | 26,535.44 | 27,220.20 | 28,215.36 | 28,900.12 | 29,895.28 | 30,580.04 |
| Fibonacci | 26,587.17 | 27,228.90 | 27,625.36 | 28,267.09 | 28,908.82 | 29,305.28 | 29,947.01 |
Numerical data
The following is the status of technical indicators and moving averages registered at the time this technical analysis was created:
| RSI (14): | 47.14 | |
| MACD (12,26,9): | 35.9200 | |
| Directional Movement: | -5.18 | |
| AROON (14): | -57.15 | |
| DEMA (21): | 28,175.45 | |
| Parabolic SAR (0,02-0,02-0,2): | 27,421.07 | |
| Elder Ray (13): | -136.09 | |
| Super Trend (3,10): | 27,610.98 | |
| Zig ZAG (10): | 27,866.80 | |
| VORTEX (21): | 0.8000 | |
| Stochastique (14,3,5): | 69.39 | |
| TEMA (21): | 28,032.98 | |
| Williams %R (14): | -60.76 | |
| Chande Momentum Oscillator (20): | -45.16 | |
| Repulse (5,40,3): | -0.6800 | |
| ROCnROLL: | -1 | |
| TRIX (15,9): | 0.0200 | |
| Courbe Coppock: | 3.36 |
| MA7: | 28,050.11 | |
| MA20: | 28,203.86 | |
| MA50: | 27,809.24 | |
| MA100: | 27,306.78 | |
| MAexp7: | 28,120.06 | |
| MAexp20: | 28,099.46 | |
| MAexp50: | 27,857.76 | |
| MAexp100: | 27,617.33 | |
| Price / MA7: | -0.68% | |
| Price / MA20: | -1.22% | |
| Price / MA50: | +0.18% | |
| Price / MA100: | +2.03% | |
| Price / MAexp7: | -0.92% | |
| Price / MAexp20: | -0.85% | |
| Price / MAexp50: | +0.01% | |
| Price / MAexp100: | +0.88% |
News
Don't forget to follow the news on NIKKEI 225. At the time of publication of this analysis, the latest news was as follows:
-
 DAX and Nikkei 225 Forecast July 13, 2022
-
DAX and Nikkei 225 Forecast June 28, 2022
-
DAX and Nikkei 225 Forecast June 24, 2022
-
DAX and Nikkei 225 Forecast June 10, 2022
-
DAX and Nikkei 225 Forecast June 2, 2022
About author
Online


Add a comment
Comments
0 comments on the analysis NIKKEI 225 - Daily