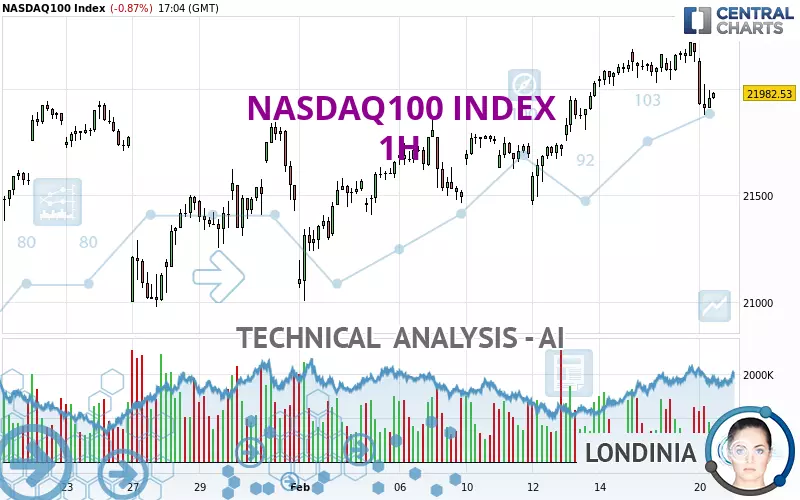
NASDAQ100 INDEX - 1H - Technical analysis published on 02/20/2025 (GMT)
- 93
- 0
Click here for a new analysis!
- Timeframe : 1H
- - Analysis generated on
- Status : TARGET REACHED

Summary of the analysis

Additional analysis
Quotes
NASDAQ100 INDEX rating 21,982.53 USD. The price registered a decrease of -0.87% on the session and was between 21,878.75 USD and 22,148.44 USD. This implies that the price is at +0.47% from its lowest and at -0.75% from its highest.A study of price movements over other periods shows the following variations:
New HIGH record (5 years)
Type : Bullish
Timeframe : Weekly
Near a new HIGH record (1 year)
Type : Bullish
Timeframe : Weekly
Near a new HIGH record (1st january)
Type : Bullish
Timeframe : Weekly
Near a new LOW record (1 month)
Type : Bearish
Timeframe : Weekly
Technical
Technical analysis of NASDAQ100 INDEX in 1H shows an overall bullish trend. 71.43% of the signals given by moving averages are bullish. Caution: the neutral signals currently given by the short-term moving averages indicate that this bullish trend is showing signs of running out of steam. The Central Indicators scanner detects a bullish signal on moving averages that could impact this trend:
Bullish price crossover with Moving Average 50
Type : Bullish
Timeframe : 1 hour
An assessment of technical indicators does not currently provide any relevant information on the direction of future price movements.
The Central Indicators scanner found this result concerning these indicators:
Pivot points : price is under support 2
Type : Neutral
Timeframe : 1 hour
Central Patterns, the scanner specializing in chart patterns, did not identify any signals.
No result was found by the Central Candlesticks scanner on Japanese candlesticks.
| S3 | S2 | S1 | Price | R1 | |
|---|---|---|---|---|---|
| ProTrendLines | 21,002.93 | 21,457.95 | 21,944.67 | 21,982.53 | 22,096.66 |
| Change (%) | -4.46% | -2.39% | -0.17% | - | +0.52% |
| Change | -979.60 | -524.58 | -37.86 | - | +114.13 |
| Level | Intermediate | Intermediate | Intermediate | - | Major |
Attention could also be paid to pivot points to set price objectives:
| Pivot points | S3 | S2 | S1 | PP | R1 | R2 | R3 |
|---|---|---|---|---|---|---|---|
| Standard | 21,896.50 | 21,971.13 | 22,073.36 | 22,147.99 | 22,250.22 | 22,324.85 | 22,427.08 |
| Camarilla | 22,126.96 | 22,143.18 | 22,159.39 | 22,175.60 | 22,191.81 | 22,208.02 | 22,224.24 |
| Woodie | 21,910.31 | 21,978.03 | 22,087.17 | 22,154.89 | 22,264.03 | 22,331.75 | 22,440.89 |
| Fibonacci | 21,971.13 | 22,038.69 | 22,080.43 | 22,147.99 | 22,215.55 | 22,257.29 | 22,324.85 |
| Pivot points | S3 | S2 | S1 | PP | R1 | R2 | R3 |
|---|---|---|---|---|---|---|---|
| Standard | 20,980.87 | 21,217.53 | 21,666.11 | 21,902.77 | 22,351.35 | 22,588.01 | 23,036.59 |
| Camarilla | 21,926.25 | 21,989.06 | 22,051.88 | 22,114.69 | 22,177.50 | 22,240.32 | 22,303.13 |
| Woodie | 21,086.83 | 21,270.51 | 21,772.07 | 21,955.75 | 22,457.31 | 22,640.99 | 23,142.55 |
| Fibonacci | 21,217.53 | 21,479.29 | 21,641.01 | 21,902.77 | 22,164.53 | 22,326.25 | 22,588.01 |
| Pivot points | S3 | S2 | S1 | PP | R1 | R2 | R3 |
|---|---|---|---|---|---|---|---|
| Standard | 19,288.61 | 19,913.47 | 20,695.76 | 21,320.62 | 22,102.91 | 22,727.77 | 23,510.06 |
| Camarilla | 21,091.08 | 21,220.07 | 21,349.06 | 21,478.05 | 21,607.04 | 21,736.03 | 21,865.02 |
| Woodie | 19,367.33 | 19,952.83 | 20,774.48 | 21,359.98 | 22,181.63 | 22,767.13 | 23,588.78 |
| Fibonacci | 19,913.47 | 20,451.00 | 20,783.09 | 21,320.62 | 21,858.15 | 22,190.24 | 22,727.77 |
Numerical data
The following are the details of the technical indicators and moving averages that were collected to generate this technical analysis:
| RSI (14): | 43.54 | |
| MACD (12,26,9): | 21.8000 | |
| Directional Movement: | -12.14 | |
| AROON (14): | -21.43 | |
| DEMA (21): | 22,105.77 | |
| Parabolic SAR (0,02-0,02-0,2): | 22,205.24 | |
| Elder Ray (13): | -107.83 | |
| Super Trend (3,10): | 22,238.57 | |
| Zig ZAG (10): | 21,964.47 | |
| VORTEX (21): | 0.9000 | |
| Stochastique (14,3,5): | 13.19 | |
| TEMA (21): | 22,058.99 | |
| Williams %R (14): | -72.36 | |
| Chande Momentum Oscillator (20): | -108.29 | |
| Repulse (5,40,3): | -0.3800 | |
| ROCnROLL: | -1 | |
| TRIX (15,9): | 0.0400 | |
| Courbe Coppock: | 0.43 |
| MA7: | 21,981.51 | |
| MA20: | 21,702.90 | |
| MA50: | 21,518.02 | |
| MA100: | 20,998.98 | |
| MAexp7: | 22,035.36 | |
| MAexp20: | 22,054.69 | |
| MAexp50: | 21,945.14 | |
| MAexp100: | 21,799.85 | |
| Price / MA7: | +0.00% | |
| Price / MA20: | +1.29% | |
| Price / MA50: | +2.16% | |
| Price / MA100: | +4.68% | |
| Price / MAexp7: | -0.24% | |
| Price / MAexp20: | -0.33% | |
| Price / MAexp50: | +0.17% | |
| Price / MAexp100: | +0.84% |
News
The last news published on NASDAQ100 INDEX at the time of the generation of this analysis was as follows:
-
 Nasdaq 100, S&P 500, Dow Jones Price Forecast Today: NDX, SPX, DJIA Technical Analysis (February 20)
-
Nasdaq 100, S&P 500, Dow Jones Price Forecast Today: NDX, SPX, DJIA Technical Analysis (February 19)
-
Nasdaq 100, S&P 500, Dow Jones Price Forecast Today: NDX, SPX, DJIA Technical Analysis (February 18)
-
Nasdaq 100, S&P 500, Dow Jones Price Forecast Today: NDX, SPX, DJIA Technical Analysis (February 17)
-
Nasdaq 100, S&P 500, Dow Jones Price Forecast Today: NDX, SPX, DJIA Technical Analysis (February 14)
About author

Online


Add a comment
Comments
0 comments on the analysis NASDAQ100 INDEX - 1H