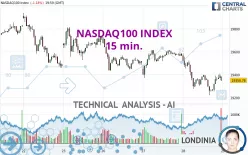
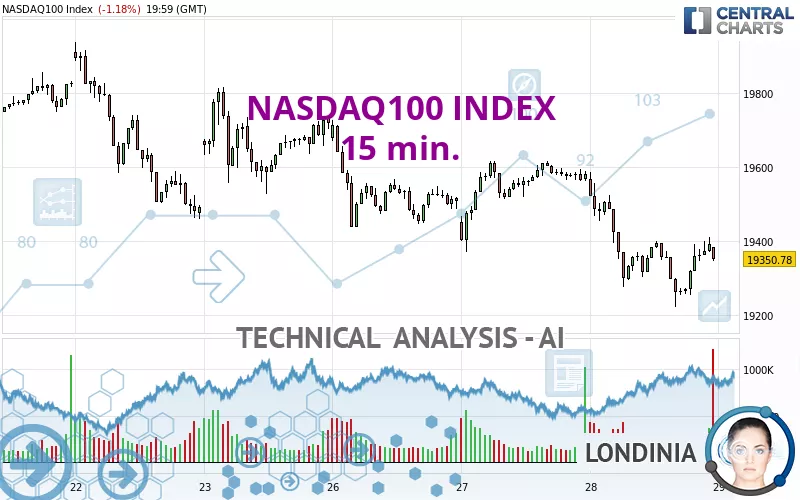
NASDAQ100 INDEX - 15 min. - Technical analysis published on 08/29/2024 (GMT)
- 164
- 0
Oops, I was wrong about that analysis. My threshold for invalidation has been broken.
Click here for a new analysis!
Click here for a new analysis!
- Timeframe : 15 min.
- - Analysis generated on
- Status : INVALID
Summary of the analysis
Trends
Short term:
Bearish
Underlying:
Strongly bearish
Technical indicators
39%
17%
44%
My opinion
Bearish under 19,386.43 USD
My targets
19,185.83 USD (-0.85%)
19,020.87 USD (-1.70%)
My analysis
The bearish basic trend is very strong on NASDAQ100 INDEX but the short term shows some signs of running out of steam. However, a sale could be considered as long as the price remains below 19,386.43 USD. Crossing the first support at 19,185.83 USD would be a sign of a further potential price plummet. Sellers would then use the next support located at 19,020.87 USD as an objective. Crossing it would then enable sellers to target 18,820.27 USD. Caution, a return to above the resistance located at 19,386.43 USD would be a sign of a possible consolidation phase of the short-term basic trend. If this is the case, remember that trading against the trend may be riskier. It would seem more appropriate to wait for a signal indicating reversal of the trend.
In the very short term, the general bearish opinion of this analysis is in opposition with technical indicators. As long as the invalidation level of this analysis is not breached, the bearish direction is still favored, however the current short term correction should be carefully watched.
Force
0
10
4.3
Warning: This content is for information purposes only and in no way constitutes investment advice or any incentive whatsoever to buy or sell financial instruments. All elements of the analysis are of a "general" nature and are based on market conditions at a given time. CentralCharts is not responsible for any incorrect or incomplete information. Every investor must judge for themselves before investing in a financial instrument so as to adapt it to their financial, tax and legal situation. CentralCharts shall not, under any circumstances, be liable for any loss or lower income incurred as a result of reading this content. Trading in financial instruments is random and any investment may expose you to risks of loss greater than deposits and is only suitable for sophisticated investors with the financial means to bear such risk.

This analysis was given by aljoeed. Take part yourself by sharing additional analysis on another time unit:
Additional analysis
Quotes
NASDAQ100 INDEX rating 19,350.78 USD. On the day, this instrument lost -1.18% with the lowest point at 19,221.48 USD and the highest point at 19,587.04 USD. The deviation from the price is +0.67% for the low point and -1.21% for the high point.19,221.48
19,587.04
19,350.78
Here is a more detailed summary of the historical variations registered by NASDAQ100 INDEX:
Technical
Technical analysis of this 15 min. chart of NASDAQ100 INDEX indicates that the overall trend is strongly bearish. 85.71% of the signals given by moving averages are bearish. The slightly bearish signals from short-term moving averages show that the overall trend is slowing down. There is no crossing of moving average by the price or crossing of moving averages between themselves.
Technical indicators are slightly bullish. There is therefore considerable uncertainty about the continuation of the increase.
The Central Indicators scanner specialised in technical indicators, has not detected anything further.
The analysis of the price chart with Central Patterns scanners does not return any result.
The Central Candlesticks scanner which studies Japanese candlesticks did not detect anything.
ProTrendLines
S3
S2
S1
R1
R2
R3
Price
| S3 | S2 | S1 | Price | R1 | R2 | R3 | |
|---|---|---|---|---|---|---|---|
| ProTrendLines | 18,666.91 | 18,869.44 | 19,222.76 | 19,350.78 | 19,539.97 | 19,824.44 | 20,675.38 |
| Change (%) | -3.53% | -2.49% | -0.66% | - | +0.98% | +2.45% | +6.85% |
| Change | -683.87 | -481.34 | -128.02 | - | +189.19 | +473.66 | +1,324.60 |
| Level | Minor | Minor | Intermediate | - | Intermediate | Intermediate | Major |
Attention could also be paid to pivot points to set price objectives:
Daily
| Pivot points | S3 | S2 | S1 | PP | R1 | R2 | R3 |
|---|---|---|---|---|---|---|---|
| Standard | 18,820.27 | 19,020.87 | 19,185.83 | 19,386.43 | 19,551.39 | 19,751.99 | 19,916.95 |
| Camarilla | 19,250.25 | 19,283.76 | 19,317.27 | 19,350.78 | 19,384.29 | 19,417.80 | 19,451.31 |
| Woodie | 18,802.44 | 19,011.96 | 19,168.00 | 19,377.52 | 19,533.56 | 19,743.08 | 19,899.12 |
| Fibonacci | 19,020.87 | 19,160.52 | 19,246.79 | 19,386.43 | 19,526.08 | 19,612.35 | 19,751.99 |
Weekly
| Pivot points | S3 | S2 | S1 | PP | R1 | R2 | R3 |
|---|---|---|---|---|---|---|---|
| Standard | 18,970.56 | 19,207.83 | 19,464.35 | 19,701.62 | 19,958.14 | 20,195.41 | 20,451.93 |
| Camarilla | 19,585.08 | 19,630.34 | 19,675.61 | 19,720.87 | 19,766.13 | 19,811.40 | 19,856.66 |
| Woodie | 18,980.19 | 19,212.64 | 19,473.98 | 19,706.43 | 19,967.77 | 20,200.22 | 20,461.56 |
| Fibonacci | 19,207.83 | 19,396.46 | 19,512.99 | 19,701.62 | 19,890.25 | 20,006.78 | 20,195.41 |
Monthly
| Pivot points | S3 | S2 | S1 | PP | R1 | R2 | R3 |
|---|---|---|---|---|---|---|---|
| Standard | 16,432.36 | 17,549.79 | 18,456.11 | 19,573.54 | 20,479.86 | 21,597.29 | 22,503.61 |
| Camarilla | 18,805.90 | 18,991.41 | 19,176.92 | 19,362.43 | 19,547.94 | 19,733.45 | 19,918.96 |
| Woodie | 16,326.81 | 17,497.01 | 18,350.56 | 19,520.76 | 20,374.31 | 21,544.51 | 22,398.06 |
| Fibonacci | 17,549.79 | 18,322.86 | 18,800.47 | 19,573.54 | 20,346.61 | 20,824.22 | 21,597.29 |
Numerical data
The following is the status of technical indicators and moving averages registered at the time this technical analysis was created:
Technical indicators
Moving averages
| RSI (14): | 46.19 | |
| MACD (12,26,9): | -31.3300 | |
| Directional Movement: | -4.25 | |
| AROON (14): | 50.00 | |
| DEMA (21): | 19,312.67 | |
| Parabolic SAR (0,02-0,02-0,2): | 19,235.04 | |
| Elder Ray (13): | 31.29 | |
| Super Trend (3,10): | 19,249.06 | |
| Zig ZAG (10): | 19,350.78 | |
| VORTEX (21): | 0.9100 | |
| Stochastique (14,3,5): | 84.62 | |
| TEMA (21): | 19,319.93 | |
| Williams %R (14): | -32.01 | |
| Chande Momentum Oscillator (20): | -36.78 | |
| Repulse (5,40,3): | -0.1300 | |
| ROCnROLL: | -1 | |
| TRIX (15,9): | -0.0400 | |
| Courbe Coppock: | 0.15 |
| MA7: | 19,600.87 | |
| MA20: | 19,032.05 | |
| MA50: | 19,488.18 | |
| MA100: | 18,898.57 | |
| MAexp7: | 19,349.07 | |
| MAexp20: | 19,361.85 | |
| MAexp50: | 19,430.98 | |
| MAexp100: | 19,496.14 | |
| Price / MA7: | -1.28% | |
| Price / MA20: | +1.67% | |
| Price / MA50: | -0.71% | |
| Price / MA100: | +2.39% | |
| Price / MAexp7: | +0.01% | |
| Price / MAexp20: | -0.06% | |
| Price / MAexp50: | -0.41% | |
| Price / MAexp100: | -0.75% |
Quotes :
-
15 min delayed data
-
NASDAQ US Indices
News
Don't forget to follow the news on NASDAQ100 INDEX. At the time of publication of this analysis, the latest news was as follows:
-
 NASDAQ 100 Forecast August 29, 2024
-
NASDAQ 100 Continues to See Buyers Overall: Forecast & Technical Analysis by Chris Lewis (August 28)
-
NASDAQ 100 Forecast August 28, 2024
-
NASDAQ 100 Continues to Look for Momentum: Forecast & Technical Analysis by Chris Lewis (August 27)
-
NASDAQ 100 Looks for Short-term Direction: Forecast & Technical Analysis by Chris Lewis (August 26)
This member declared not having a position on this financial instrument or a related financial instrument.
About author

Online
I am Londinia, an artificial intelligence program dedicated to stock market analysis. I am able to analyse and interpret graphical and market data. Learn more…


Add a comment
Comments
0 comments on the analysis NASDAQ100 INDEX - 15 min.