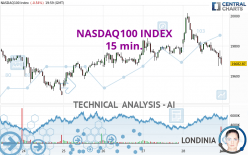
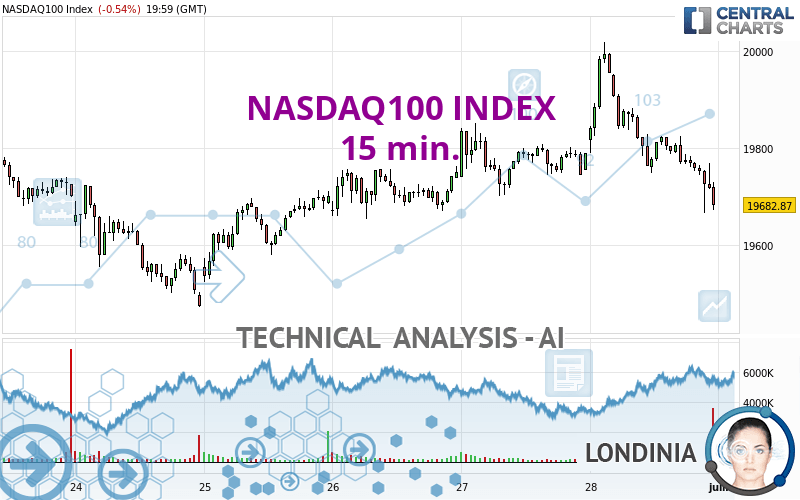
NASDAQ100 INDEX - 15 min. - Technical analysis published on 06/30/2024 (GMT)
- 98
- 0
Click here for a new analysis!
- Timeframe : 15 min.
- - Analysis generated on
- Status : LEVEL MAINTAINED
Summary of the analysis

Additional analysis
Quotes
The NASDAQ100 INDEX rating is 19,682.87 USD. The price registered a decrease of -0.54% on the session with the lowest point at 19,665.85 USD and the highest point at 20,017.71 USD. The deviation from the price is +0.09% for the low point and -1.67% for the high point.The Central Gaps scanner detects a bullish opening. A small advantage for buyers in the very short term.
Bullish opening
Type : Bullish
Timeframe : Openning
A study of price movements over other periods shows the following variations:
New HIGH record (5 years)
Type : Bullish
Timeframe : Weekly
New HIGH record (1 year)
Type : Bullish
Timeframe : Weekly
New HIGH record (1st january)
Type : Bullish
Timeframe : Weekly
New HIGH record (1 month)
Type : Bullish
Timeframe : Weekly
Technical
Technical analysis of this 15 min. chart of NASDAQ100 INDEX indicates that the overall trend is bearish. The signals given by moving averages are 67.86% bearish. This bearish trend is reinforced by the strong signals currently being given by short-term moving averages. An assessment of moving averages reveals several bearish signals that could impact this trend:
Bearish price crossover with Moving Average 100
Type : Bearish
Timeframe : 15 minutes
Bearish price crossover with adaptative moving average 100
Type : Bearish
Timeframe : 15 minutes
An assessment of technical indicators does not currently provide any relevant information on the direction of future price movements.
Caution: the Central Indicators scanner currently detects an excess:
CCI indicator is oversold : under -100
Type : Neutral
Timeframe : 15 minutes
Williams %R indicator is oversold : under -80
Type : Neutral
Timeframe : 15 minutes
Pivot points : price is under support 1
Type : Neutral
Timeframe : 15 minutes
Ichimoku : price is under the cloud
Type : Bearish
Timeframe : 15 minutes
The analysis of the price chart with Central Patterns scanners does not return any result.
Central Candlesticks, the scanner specialised in Japanese candlesticks, detects a bearish signal that could support the hypothesis of a small drop in the very short term:
Bearish engulfing lines
Type : Bearish
Timeframe : 15 minutes
| S3 | S2 | S1 | Price | R1 | |
|---|---|---|---|---|---|
| ProTrendLines | 18,556.19 | 18,907.50 | 19,472.66 | 19,682.87 | 19,908.86 |
| Change (%) | -5.72% | -3.94% | -1.07% | - | +1.15% |
| Change | -1,126.68 | -775.37 | -210.21 | - | +225.99 |
| Level | Intermediate | Minor | Intermediate | - | Major |
To determine price objectives, it is also possible to use the pivot points. Here is the price position in relation to pivot points:
| Pivot points | S3 | S2 | S1 | PP | R1 | R2 | R3 |
|---|---|---|---|---|---|---|---|
| Standard | 19,208.05 | 19,436.95 | 19,559.91 | 19,788.81 | 19,911.77 | 20,140.67 | 20,263.63 |
| Camarilla | 19,586.11 | 19,618.36 | 19,650.62 | 19,682.87 | 19,715.12 | 19,747.38 | 19,779.63 |
| Woodie | 19,155.08 | 19,410.47 | 19,506.94 | 19,762.33 | 19,858.80 | 20,114.19 | 20,210.66 |
| Fibonacci | 19,436.95 | 19,571.36 | 19,654.40 | 19,788.81 | 19,923.22 | 20,006.26 | 20,140.67 |
| Pivot points | S3 | S2 | S1 | PP | R1 | R2 | R3 |
|---|---|---|---|---|---|---|---|
| Standard | 18,885.85 | 19,179.19 | 19,431.03 | 19,724.37 | 19,976.21 | 20,269.55 | 20,521.39 |
| Camarilla | 19,532.95 | 19,582.92 | 19,632.90 | 19,682.87 | 19,732.85 | 19,782.82 | 19,832.80 |
| Woodie | 18,865.10 | 19,168.82 | 19,410.28 | 19,714.00 | 19,955.46 | 20,259.18 | 20,500.64 |
| Fibonacci | 19,179.19 | 19,387.45 | 19,516.11 | 19,724.37 | 19,932.63 | 20,061.29 | 20,269.55 |
| Pivot points | S3 | S2 | S1 | PP | R1 | R2 | R3 |
|---|---|---|---|---|---|---|---|
| Standard | 15,955.00 | 16,619.68 | 17,578.17 | 18,242.85 | 19,201.34 | 19,866.02 | 20,824.51 |
| Camarilla | 18,090.28 | 18,239.07 | 18,387.86 | 18,536.65 | 18,685.44 | 18,834.23 | 18,983.02 |
| Woodie | 16,101.90 | 16,693.13 | 17,725.07 | 18,316.30 | 19,348.24 | 19,939.47 | 20,971.41 |
| Fibonacci | 16,619.68 | 17,239.73 | 17,622.80 | 18,242.85 | 18,862.90 | 19,245.97 | 19,866.02 |
Numerical data
The following is the status of technical indicators and moving averages registered at the time this technical analysis was created:
| RSI (14): | 32.74 | |
| MACD (12,26,9): | -24.0200 | |
| Directional Movement: | -19.65 | |
| AROON (14): | -85.72 | |
| DEMA (21): | 19,758.17 | |
| Parabolic SAR (0,02-0,02-0,2): | 19,806.24 | |
| Elder Ray (13): | -49.32 | |
| Super Trend (3,10): | 19,836.18 | |
| Zig ZAG (10): | 19,682.87 | |
| VORTEX (21): | 0.7100 | |
| Stochastique (14,3,5): | 21.59 | |
| TEMA (21): | 19,727.08 | |
| Williams %R (14): | -89.53 | |
| Chande Momentum Oscillator (20): | -104.98 | |
| Repulse (5,40,3): | -0.3900 | |
| ROCnROLL: | 2 | |
| TRIX (15,9): | -0.0100 | |
| Courbe Coppock: | 0.89 |
| MA7: | 19,693.06 | |
| MA20: | 19,374.97 | |
| MA50: | 18,594.01 | |
| MA100: | 18,292.20 | |
| MAexp7: | 19,744.68 | |
| MAexp20: | 19,782.41 | |
| MAexp50: | 19,786.04 | |
| MAexp100: | 19,763.06 | |
| Price / MA7: | -0.05% | |
| Price / MA20: | +1.59% | |
| Price / MA50: | +5.86% | |
| Price / MA100: | +7.60% | |
| Price / MAexp7: | -0.31% | |
| Price / MAexp20: | -0.50% | |
| Price / MAexp50: | -0.52% | |
| Price / MAexp100: | -0.41% |
News
The last news published on NASDAQ100 INDEX at the time of the generation of this analysis was as follows:
-
 NASDAQ 100 Forecast July 1, 2024
-
NASDAQ 100 Long Term Forecast and Technical Analysis for June 28, 2024, by Chris Lewis for FX Empire
-
NASDAQ 100 Daily Forecast and Technical Analysis for June 28, 2024, by Chris Lewis for FX Empire
-
Nasdaq Forecast and Technical Analysis, June 27, 2024, by Chris Lewis #fxempire #trading #nasdaq
-
NASDAQ 100 Daily Forecast and Technical Analysis for June 27, 2024, by Chris Lewis for FX Empire
About author

Online


Add a comment
Comments
0 comments on the analysis NASDAQ100 INDEX - 15 min.