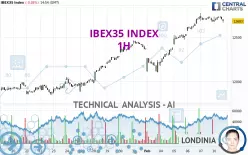
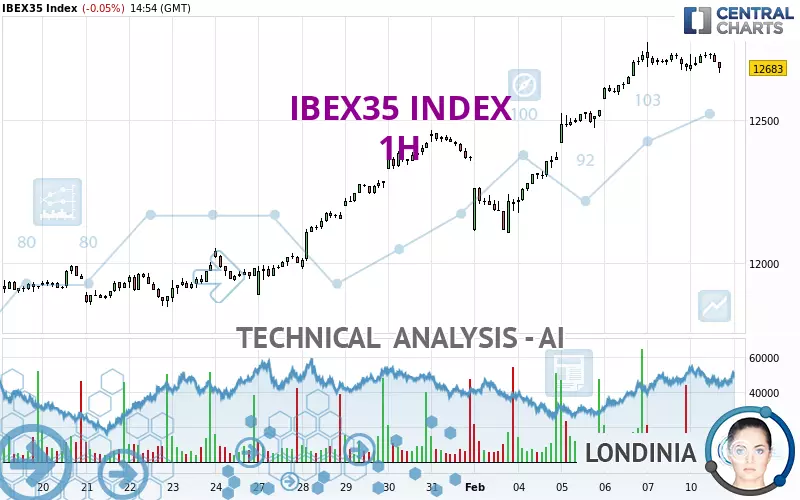
IBEX35 INDEX - 1H - Technical analysis published on 02/10/2025 (GMT)
- 132
- 0
Click here for a new analysis!
- Timeframe : 1H
- - Analysis generated on
- Status : TARGET REACHED
Summary of the analysis

Additional analysis
Quotes
IBEX35 INDEX rating 12,683.50 EUR. The price registered a decrease of -0.04% on the session and was between 12,664.60 EUR and 12,739.30 EUR. This implies that the price is at +0.15% from its lowest and at -0.44% from its highest.A bearish opening was detected by the Central Gaps scanner. Sellers are trying to impose a bearish trend in the very short term.
Bearish opening
Type : Bearish
Timeframe : Openning
A study of price movements over other periods shows the following variations:
Near a new HIGH record (5 years)
Type : Bullish
Timeframe : Weekly
Near a new HIGH record (1 year)
Type : Bullish
Timeframe : Weekly
Near a new HIGH record (1st january)
Type : Bullish
Timeframe : Weekly
Near a new HIGH record (1 month)
Type : Bullish
Timeframe : Weekly
Technical
Technical analysis of IBEX35 INDEX in 1H shows a strongly overall bullish trend. 85.71% of the signals given by moving averages are bullish. The slightly bullish signals given by the short-term moving averages indicate this trend is showing signs of running out of steam. The Central Indicators scanner detects a bearish signal on moving averages that could impact this trend:
Bearish price crossover with Moving Average 20
Type : Bearish
Timeframe : 1 hour
The technical indicators are generally neutral. They do not provide relevant information on the direction of future price movements.
Caution: the Central Indicators scanner currently detects an excess:
CCI indicator is oversold : under -100
Type : Neutral
Timeframe : 1 hour
Williams %R indicator is oversold : under -80
Type : Neutral
Timeframe : 1 hour
Central Patterns, the scanner specializing in chart patterns, did not identify any signals.
The presence of a bullish Japanese candlestick pattern detected by Central Candlesticks that could cause a very short term rebound was also detected:
Bullish doji star
Type : Bullish
Timeframe : 1 hour
| S3 | S2 | S1 | Price | R1 | |
|---|---|---|---|---|---|
| ProTrendLines | 11,866.40 | 12,105.26 | 12,468.27 | 12,683.50 | 12,775.40 |
| Change (%) | -6.44% | -4.56% | -1.70% | - | +0.72% |
| Change | -817.10 | -578.24 | -215.23 | - | +91.90 |
| Level | Major | Minor | Intermediate | - | Intermediate |
To determine price objectives, it is also possible to use the pivot points. Here is the price position in relation to pivot points:
| Pivot points | S3 | S2 | S1 | PP | R1 | R2 | R3 |
|---|---|---|---|---|---|---|---|
| Standard | 12,546.13 | 12,609.37 | 12,649.13 | 12,712.37 | 12,752.13 | 12,815.37 | 12,855.13 |
| Camarilla | 12,660.58 | 12,670.02 | 12,679.46 | 12,688.90 | 12,698.34 | 12,707.78 | 12,717.23 |
| Woodie | 12,534.40 | 12,603.50 | 12,637.40 | 12,706.50 | 12,740.40 | 12,809.50 | 12,843.40 |
| Fibonacci | 12,609.37 | 12,648.71 | 12,673.02 | 12,712.37 | 12,751.71 | 12,776.02 | 12,815.37 |
| Pivot points | S3 | S2 | S1 | PP | R1 | R2 | R3 |
|---|---|---|---|---|---|---|---|
| Standard | 11,593.97 | 11,847.63 | 12,268.27 | 12,521.93 | 12,942.57 | 13,196.23 | 13,616.87 |
| Camarilla | 12,503.47 | 12,565.28 | 12,627.09 | 12,688.90 | 12,750.71 | 12,812.52 | 12,874.33 |
| Woodie | 11,677.45 | 11,889.38 | 12,351.75 | 12,563.68 | 13,026.05 | 13,237.98 | 13,700.35 |
| Fibonacci | 11,847.63 | 12,105.22 | 12,264.35 | 12,521.93 | 12,779.52 | 12,938.65 | 13,196.23 |
| Pivot points | S3 | S2 | S1 | PP | R1 | R2 | R3 |
|---|---|---|---|---|---|---|---|
| Standard | 10,718.80 | 11,087.50 | 11,728.20 | 12,096.90 | 12,737.60 | 13,106.30 | 13,747.00 |
| Camarilla | 12,091.32 | 12,183.84 | 12,276.37 | 12,368.90 | 12,461.43 | 12,553.96 | 12,646.49 |
| Woodie | 10,854.80 | 11,155.50 | 11,864.20 | 12,164.90 | 12,873.60 | 13,174.30 | 13,883.00 |
| Fibonacci | 11,087.50 | 11,473.09 | 11,711.31 | 12,096.90 | 12,482.49 | 12,720.71 | 13,106.30 |
Numerical data
The following is the status of technical indicators and moving averages registered at the time this technical analysis was created:
| RSI (14): | 59.48 | |
| MACD (12,26,9): | 46.3800 | |
| Directional Movement: | 14.07 | |
| AROON (14): | 28.57 | |
| DEMA (21): | 12,752.35 | |
| Parabolic SAR (0,02-0,02-0,2): | 12,748.70 | |
| Elder Ray (13): | -4.28 | |
| Super Trend (3,10): | 12,625.16 | |
| Zig ZAG (10): | 12,692.60 | |
| VORTEX (21): | 1.1400 | |
| Stochastique (14,3,5): | 44.21 | |
| TEMA (21): | 12,732.75 | |
| Williams %R (14): | -69.11 | |
| Chande Momentum Oscillator (20): | -8.40 | |
| Repulse (5,40,3): | -0.2100 | |
| ROCnROLL: | -1 | |
| TRIX (15,9): | 0.0700 | |
| Courbe Coppock: | 0.19 |
| MA7: | 12,513.96 | |
| MA20: | 12,179.06 | |
| MA50: | 11,907.38 | |
| MA100: | 11,817.95 | |
| MAexp7: | 12,708.79 | |
| MAexp20: | 12,681.22 | |
| MAexp50: | 12,562.48 | |
| MAexp100: | 12,402.09 | |
| Price / MA7: | +1.35% | |
| Price / MA20: | +4.14% | |
| Price / MA50: | +6.52% | |
| Price / MA100: | +7.32% | |
| Price / MAexp7: | -0.20% | |
| Price / MAexp20: | +0.02% | |
| Price / MAexp50: | +0.96% | |
| Price / MAexp100: | +2.27% |
News
The latest news and videos published on IBEX35 INDEX at the time of the analysis were as follows:
-
 IBEX 35 Forecast October 28, 2024
-
IBEX 35 Forecast September 11, 2024
-
IBEX 35 Forecast August 27, 2024
-
IBEX 35 Forecast August 26, 2024
-
Will the IBEX 35 turn lower again? - 16th January 2019
About author
Online


Add a comment
Comments
0 comments on the analysis IBEX35 INDEX - 1H