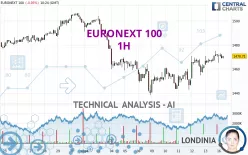
EURONEXT 100 - 1H - Technical analysis published on 09/16/2024 (GMT)
- 147
- 0
Click here for a new analysis!
- Timeframe : 1H
- - Analysis generated on
- Status : TARGET REACHED

Summary of the analysis

Additional analysis
Quotes
The EURONEXT 100 price is 1,470.71 EUR. The price is lower by -0.05% since the last closing and was traded between 1,465.10 EUR and 1,472.85 EUR over the period. The price is currently at +0.38% from its lowest and -0.15% from its highest.The Central Gaps scanner detects a bearish opening. A small advantage for sellers in the very short term.
Bearish opening
Type : Bearish
Timeframe : Openning
So that you have an overall view of the price change, here is a table showing the variations over several periods:
Near a new HIGH record (1 month)
Type : Bullish
Timeframe : Weekly
Technical
Technical analysis of EURONEXT 100 in 1H shows an overall bullish trend. The signals returned by the moving averages are 71.43% bullish. This bullish trend is reinforced by the strong signals currently being given by short-term moving averages. The Central Indicators market scanner is currently detecting a bearish signal that could impact this trend:
Bearish price crossover with adaptative moving average 100
Type : Bearish
Timeframe : 1 hour
The technical indicators are bullish. There is still some doubt about the price increase.
Central Indicators, the scanner specialised in technical indicators, has identified these signals:
MACD crosses DOWN its Moving Average
Type : Bearish
Timeframe : 1 hour
Price is back over the pivot point
Type : Bullish
Timeframe : 1 hour
Price is back under the pivot point
Type : Bearish
Timeframe : 1 hour
Central Patterns, the scanner specializing in chart patterns, did not identify any signals.
Central Candlesticks, the scanner specialised in Japanese candlesticks, detects these signals that could have an impact on the current short-term trend:
Bullish harami
Type : Bullish
Timeframe : 1 hour
Doji
Type : Neutral
Timeframe : 1 hour
| S3 | S2 | S1 | Price | R1 | R2 | R3 | |
|---|---|---|---|---|---|---|---|
| ProTrendLines | 1,390.77 | 1,440.74 | 1,459.49 | 1,470.71 | 1,475.66 | 1,485.61 | 1,494.71 |
| Change (%) | -5.44% | -2.04% | -0.76% | - | +0.34% | +1.01% | +1.63% |
| Change | -79.94 | -29.97 | -11.22 | - | +4.95 | +14.90 | +24.00 |
| Level | Major | Intermediate | Major | - | Intermediate | Intermediate | Intermediate |
Attention could also be paid to pivot points to set price objectives:
| Pivot points | S3 | S2 | S1 | PP | R1 | R2 | R3 |
|---|---|---|---|---|---|---|---|
| Standard | 1,453.22 | 1,458.30 | 1,464.86 | 1,469.94 | 1,476.50 | 1,481.58 | 1,488.14 |
| Camarilla | 1,468.22 | 1,469.29 | 1,470.35 | 1,471.42 | 1,472.49 | 1,473.55 | 1,474.62 |
| Woodie | 1,453.96 | 1,458.67 | 1,465.60 | 1,470.31 | 1,477.24 | 1,481.95 | 1,488.88 |
| Fibonacci | 1,458.30 | 1,462.75 | 1,465.49 | 1,469.94 | 1,474.39 | 1,477.13 | 1,481.58 |
| Pivot points | S3 | S2 | S1 | PP | R1 | R2 | R3 |
|---|---|---|---|---|---|---|---|
| Standard | 1,415.15 | 1,427.85 | 1,449.63 | 1,462.33 | 1,484.11 | 1,496.81 | 1,518.59 |
| Camarilla | 1,461.94 | 1,465.10 | 1,468.26 | 1,471.42 | 1,474.58 | 1,477.74 | 1,480.90 |
| Woodie | 1,419.70 | 1,430.12 | 1,454.18 | 1,464.60 | 1,488.66 | 1,499.08 | 1,523.14 |
| Fibonacci | 1,427.85 | 1,441.02 | 1,449.16 | 1,462.33 | 1,475.50 | 1,483.64 | 1,496.81 |
| Pivot points | S3 | S2 | S1 | PP | R1 | R2 | R3 |
|---|---|---|---|---|---|---|---|
| Standard | 1,273.74 | 1,321.87 | 1,410.12 | 1,458.25 | 1,546.50 | 1,594.63 | 1,682.88 |
| Camarilla | 1,460.87 | 1,473.37 | 1,485.87 | 1,498.37 | 1,510.87 | 1,523.37 | 1,535.88 |
| Woodie | 1,293.80 | 1,331.90 | 1,430.18 | 1,468.28 | 1,566.56 | 1,604.66 | 1,702.94 |
| Fibonacci | 1,321.87 | 1,373.97 | 1,406.15 | 1,458.25 | 1,510.35 | 1,542.53 | 1,594.63 |
Numerical data
The following is the status of technical indicators and moving averages registered at the time this technical analysis was created:
| RSI (14): | 59.73 | |
| MACD (12,26,9): | 3.6200 | |
| Directional Movement: | 9.29 | |
| AROON (14): | 71.43 | |
| DEMA (21): | 1,471.04 | |
| Parabolic SAR (0,02-0,02-0,2): | 1,459.76 | |
| Elder Ray (13): | 2.86 | |
| Super Trend (3,10): | 1,458.98 | |
| Zig ZAG (10): | 1,469.73 | |
| VORTEX (21): | 1.2100 | |
| Stochastique (14,3,5): | 78.23 | |
| TEMA (21): | 1,473.11 | |
| Williams %R (14): | -29.18 | |
| Chande Momentum Oscillator (20): | 6.67 | |
| Repulse (5,40,3): | -0.0700 | |
| ROCnROLL: | 1 | |
| TRIX (15,9): | 0.0400 | |
| Courbe Coppock: | 1.00 |
| MA7: | 1,456.10 | |
| MA20: | 1,473.27 | |
| MA50: | 1,471.75 | |
| MA100: | 1,497.49 | |
| MAexp7: | 1,469.81 | |
| MAexp20: | 1,466.43 | |
| MAexp50: | 1,463.48 | |
| MAexp100: | 1,465.61 | |
| Price / MA7: | +1.00% | |
| Price / MA20: | -0.17% | |
| Price / MA50: | -0.07% | |
| Price / MA100: | -1.79% | |
| Price / MAexp7: | +0.06% | |
| Price / MAexp20: | +0.29% | |
| Price / MAexp50: | +0.49% | |
| Price / MAexp100: | +0.35% |
About author
Online


Add a comment
Comments
0 comments on the analysis EURONEXT 100 - 1H