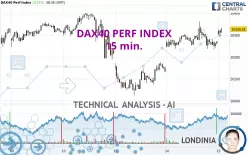
DAX40 PERF INDEX - 15 min. - Technical analysis published on 01/15/2025 (GMT)
- 219
- 0
Click here for a new analysis!
- Timeframe : 15 min.
- - Analysis generated on
- Status : TARGET REACHED

Summary of the analysis

Additional analysis
Quotes
The DAX40 PERF INDEX price is 20,326.81 EUR. The price registered an increase of +0.27% on the session and was between 20,290.62 EUR and 20,334.64 EUR. This implies that the price is at +0.18% from its lowest and at -0.04% from its highest.The Central Gaps scanner detects a bullish opening marking the presence of buyers ahead of sellers at the opening but not sufficiently marked to allow the price to register a quotation gap.
Bullish opening
Type : Bullish
Timeframe : Openning
So that you have an overall view of the price change, here is a table showing the variations over several periods:
Near a new HIGH record (5 years)
Type : Bullish
Timeframe : Weekly
Near a new LOW record (1 month)
Type : Bearish
Timeframe : Weekly
Technical
A technical analysis in 15 min. of this DAX40 PERF INDEX chart shows a bullish trend. The signals given by moving averages are 78.57% bullish. This bullish trend is slowing down slightly given the slightly bullish signals of short-term moving averages. There is no crossing of moving average by the price or crossing of moving averages between themselves.
An assessment of technical indicators shows a slightly bullish signal.
Central Indicators, the scanner specialised in technical indicators, has identified these signals:
Momentum indicator is back over 0
Type : Bullish
Timeframe : 15 minutes
Williams %R indicator is back over -50
Type : Bullish
Timeframe : 15 minutes
Central Patterns, the scanner specializing in chart patterns, did not identify any signals.
The presence of a bullish Japanese candlestick pattern detected by Central Candlesticks that could cause a very short term rebound was also detected:
Upside gap
Type : Bullish
Timeframe : 15 minutes
| S3 | S2 | S1 | Price | R1 | R2 | |
|---|---|---|---|---|---|---|
| ProTrendLines | 19,848.77 | 20,026.88 | 20,242.03 | 20,326.81 | 20,426.27 | 20,522.80 |
| Change (%) | -2.35% | -1.48% | -0.42% | - | +0.49% | +0.96% |
| Change | -478.04 | -299.93 | -84.78 | - | +99.46 | +195.99 |
| Level | Intermediate | Major | Minor | - | Major | Minor |
Attention could also be paid to pivot points to set price objectives:
| Pivot points | S3 | S2 | S1 | PP | R1 | R2 | R3 |
|---|---|---|---|---|---|---|---|
| Standard | 20,087.87 | 20,161.06 | 20,216.20 | 20,289.39 | 20,344.53 | 20,417.72 | 20,472.86 |
| Camarilla | 20,236.04 | 20,247.80 | 20,259.57 | 20,271.33 | 20,283.09 | 20,294.86 | 20,306.62 |
| Woodie | 20,078.84 | 20,156.55 | 20,207.17 | 20,284.88 | 20,335.50 | 20,413.21 | 20,463.83 |
| Fibonacci | 20,161.06 | 20,210.09 | 20,240.37 | 20,289.39 | 20,338.42 | 20,368.70 | 20,417.72 |
| Pivot points | S3 | S2 | S1 | PP | R1 | R2 | R3 |
|---|---|---|---|---|---|---|---|
| Standard | 19,371.07 | 19,646.10 | 19,930.44 | 20,205.47 | 20,489.81 | 20,764.84 | 21,049.18 |
| Camarilla | 20,060.96 | 20,112.24 | 20,163.51 | 20,214.79 | 20,266.07 | 20,317.34 | 20,368.62 |
| Woodie | 19,375.74 | 19,648.43 | 19,935.11 | 20,207.80 | 20,494.48 | 20,767.17 | 21,053.85 |
| Fibonacci | 19,646.10 | 19,859.78 | 19,991.79 | 20,205.47 | 20,419.15 | 20,551.16 | 20,764.84 |
| Pivot points | S3 | S2 | S1 | PP | R1 | R2 | R3 |
|---|---|---|---|---|---|---|---|
| Standard | 18,523.17 | 19,045.83 | 19,477.49 | 20,000.15 | 20,431.81 | 20,954.47 | 21,386.13 |
| Camarilla | 19,646.70 | 19,734.18 | 19,821.66 | 19,909.14 | 19,996.62 | 20,084.10 | 20,171.58 |
| Woodie | 18,477.66 | 19,023.08 | 19,431.98 | 19,977.40 | 20,386.30 | 20,931.72 | 21,340.62 |
| Fibonacci | 19,045.83 | 19,410.38 | 19,635.60 | 20,000.15 | 20,364.70 | 20,589.92 | 20,954.47 |
Numerical data
The following is the status of the technical indicators and moving averages at the time of publication of this technical analysis:
| RSI (14): | 51.32 | |
| MACD (12,26,9): | 4.5400 | |
| Directional Movement: | -3.71 | |
| AROON (14): | -71.42 | |
| DEMA (21): | 20,282.01 | |
| Parabolic SAR (0,02-0,02-0,2): | 20,341.39 | |
| Elder Ray (13): | -5.20 | |
| Super Trend (3,10): | 20,241.29 | |
| Zig ZAG (10): | 20,271.33 | |
| VORTEX (21): | 0.9900 | |
| Stochastique (14,3,5): | 39.95 | |
| TEMA (21): | 20,279.19 | |
| Williams %R (14): | -36.57 | |
| Chande Momentum Oscillator (20): | 17.06 | |
| Repulse (5,40,3): | 0.0900 | |
| ROCnROLL: | 1 | |
| TRIX (15,9): | 0.0100 | |
| Courbe Coppock: | 0.16 |
| MA7: | 20,273.87 | |
| MA20: | 20,164.27 | |
| MA50: | 19,766.75 | |
| MA100: | 19,389.90 | |
| MAexp7: | 20,284.69 | |
| MAexp20: | 20,270.80 | |
| MAexp50: | 20,248.97 | |
| MAexp100: | 20,239.55 | |
| Price / MA7: | +0.26% | |
| Price / MA20: | +0.81% | |
| Price / MA50: | +2.83% | |
| Price / MA100: | +4.83% | |
| Price / MAexp7: | +0.21% | |
| Price / MAexp20: | +0.28% | |
| Price / MAexp50: | +0.38% | |
| Price / MAexp100: | +0.43% |
News
The latest news and videos published on DAX40 PERF INDEX at the time of the analysis were as follows:
-
 DAX Continues to See Buyers on Each Dip
-
DAX Forecast - Will the DAX Find a Floor? (December 20, 2024)
-
DAX - Will It Finally Break Higher? (December 17, 2024 Analysis)
-
DAX Forecast - German Stocks to Continue Higher? (December 16, 2024)
-
DAX Forecast December 11, 2024
About author

Online


Add a comment
Comments
0 comments on the analysis DAX40 PERF INDEX - 15 min.