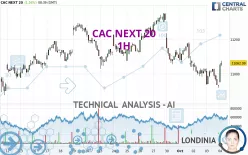
CAC NEXT 20 - 1H - Technical analysis published on 10/04/2024 (GMT)
- 159
- 0
Click here for a new analysis!
- Timeframe : 1H
- - Analysis generated on
- Status : TARGET REACHED

Summary of the analysis

Additional analysis
Quotes
The CAC NEXT 20 price is 11,062.99 EUR. On the day, this instrument gained +1.16% and was between 10,949.58 EUR and 11,075.42 EUR. This implies that the price is at +1.04% from its lowest and at -0.11% from its highest.The Central Gaps scanner detects a bullish opening. A small advantage for buyers in the very short term.
Bullish opening
Type : Bullish
Timeframe : Openning
A study of price movements over other periods shows the following variations:
Near a new HIGH record (1 month)
Type : Bullish
Timeframe : Weekly
Technical
Technical analysis of CAC NEXT 20 in 1H shows an overall bearish trend. 75.00% of the signals given by moving averages are bearish. Caution: as the signals currently given by short-term moving averages are rather neutral, the bearish trend could slow down. The Central Indicators scanner detects a bullish signal on moving averages that could impact this trend:
Bullish trend reversal : adaptative moving average 20
Type : Bullish
Timeframe : 1 hour
The probability of a further increase are moderate given the direction of the technical indicators.
Caution: the Central Indicators scanner currently detects an excess:
CCI indicator is overbought : over 100
Type : Neutral
Timeframe : 1 hour
Williams %R indicator is overbought : over -20
Type : Neutral
Timeframe : 1 hour
Pivot points : price is over resistance 2
Type : Neutral
Timeframe : 1 hour
Pivot points : price is under support 1
Type : Neutral
Timeframe : Weekly
The analysis of the price chart with Central Patterns scanners does not return any result.
Central Candlesticks, the scanner specialised in Japanese candlesticks, detects a bearish signal that could support the hypothesis of a small drop in the very short term:
Bearish doji star
Type : Bearish
Timeframe : 1 hour
| S3 | S2 | S1 | Price | R1 | R2 | R3 | |
|---|---|---|---|---|---|---|---|
| ProTrendLines | 10,875.98 | 10,964.14 | 11,029.45 | 11,062.99 | 11,183.84 | 11,295.21 | 11,381.66 |
| Change (%) | -1.69% | -0.89% | -0.30% | - | +1.09% | +2.10% | +2.88% |
| Change | -187.01 | -98.85 | -33.54 | - | +120.85 | +232.22 | +318.67 |
| Level | Intermediate | Major | Major | - | Minor | Minor | Intermediate |
Attention could also be paid to pivot points to set price objectives:
| Pivot points | S3 | S2 | S1 | PP | R1 | R2 | R3 |
|---|---|---|---|---|---|---|---|
| Standard | 10,781.62 | 10,850.33 | 10,893.24 | 10,961.95 | 11,004.86 | 11,073.57 | 11,116.48 |
| Camarilla | 10,905.46 | 10,915.69 | 10,925.92 | 10,936.15 | 10,946.38 | 10,956.61 | 10,966.85 |
| Woodie | 10,768.72 | 10,843.88 | 10,880.34 | 10,955.50 | 10,991.96 | 11,067.12 | 11,103.58 |
| Fibonacci | 10,850.33 | 10,892.97 | 10,919.31 | 10,961.95 | 11,004.59 | 11,030.93 | 11,073.57 |
| Pivot points | S3 | S2 | S1 | PP | R1 | R2 | R3 |
|---|---|---|---|---|---|---|---|
| Standard | 10,785.54 | 10,906.95 | 11,110.42 | 11,231.83 | 11,435.30 | 11,556.71 | 11,760.18 |
| Camarilla | 11,224.55 | 11,254.33 | 11,284.11 | 11,313.89 | 11,343.67 | 11,373.45 | 11,403.23 |
| Woodie | 10,826.57 | 10,927.47 | 11,151.45 | 11,252.35 | 11,476.33 | 11,577.23 | 11,801.21 |
| Fibonacci | 10,906.95 | 11,031.05 | 11,107.73 | 11,231.83 | 11,355.93 | 11,432.61 | 11,556.71 |
| Pivot points | S3 | S2 | S1 | PP | R1 | R2 | R3 |
|---|---|---|---|---|---|---|---|
| Standard | 10,300.13 | 10,562.81 | 10,827.88 | 11,090.56 | 11,355.63 | 11,618.31 | 11,883.38 |
| Camarilla | 10,947.82 | 10,996.20 | 11,044.57 | 11,092.95 | 11,141.33 | 11,189.70 | 11,238.08 |
| Woodie | 10,301.33 | 10,563.41 | 10,829.08 | 11,091.16 | 11,356.83 | 11,618.91 | 11,884.58 |
| Fibonacci | 10,562.81 | 10,764.41 | 10,888.96 | 11,090.56 | 11,292.16 | 11,416.71 | 11,618.31 |
Numerical data
The following is the status of the technical indicators and moving averages at the time of publication of this technical analysis:
| RSI (14): | 54.13 | |
| MACD (12,26,9): | -26.1200 | |
| Directional Movement: | 1.44 | |
| AROON (14): | 14.29 | |
| DEMA (21): | 10,979.93 | |
| Parabolic SAR (0,02-0,02-0,2): | 10,919.04 | |
| Elder Ray (13): | 54.13 | |
| Super Trend (3,10): | 10,931.30 | |
| Zig ZAG (10): | 11,063.30 | |
| VORTEX (21): | 0.9700 | |
| Stochastique (14,3,5): | 65.76 | |
| TEMA (21): | 10,983.85 | |
| Williams %R (14): | -8.86 | |
| Chande Momentum Oscillator (20): | 46.04 | |
| Repulse (5,40,3): | 0.6300 | |
| ROCnROLL: | -1 | |
| TRIX (15,9): | -0.0500 | |
| Courbe Coppock: | 0.45 |
| MA7: | 11,108.09 | |
| MA20: | 11,090.96 | |
| MA50: | 10,926.35 | |
| MA100: | 10,959.39 | |
| MAexp7: | 11,008.11 | |
| MAexp20: | 11,020.58 | |
| MAexp50: | 11,073.91 | |
| MAexp100: | 11,100.58 | |
| Price / MA7: | -0.41% | |
| Price / MA20: | -0.25% | |
| Price / MA50: | +1.25% | |
| Price / MA100: | +0.95% | |
| Price / MAexp7: | +0.50% | |
| Price / MAexp20: | +0.38% | |
| Price / MAexp50: | -0.10% | |
| Price / MAexp100: | -0.34% |
About author
Online


Add a comment
Comments
0 comments on the analysis CAC NEXT 20 - 1H