| Open: | 6.06 |
| Change: | +0.04 |
| Volume: | 10,953 |
| Low: | 6.06 |
| High: | 6.22 |
| High / Low range: | 0.16 |
| Type: | Indices |
| Ticker: | CN20 |
| ISIN: | QS0010989109 |
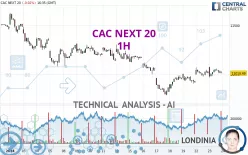
CAC NEXT 20 - 1H - Technical analysis published on 01/23/2024 (GMT)
- 126
- 0
- 01/23/2024 - 17:55
Click here for a new analysis!
- Timeframe : 1H
- - Analysis generated on 01/23/2024 - 17:55
- Status : INVALID

Summary of the analysis

Additional analysis
Quotes
CAC NEXT 20 rating 11,010.49 EUR. The price registered a decrease of -0.02% on the session with the lowest point at 10,967.66 EUR and the highest point at 11,077.21 EUR. The deviation from the price is +0.39% for the low point and -0.60% for the high point.A bullish opening was detected by the Central Gaps scanner. Buyers are trying to impose a bullish momentum in the very short term.
Bullish opening
Type : Bullish
Timeframe : Openning
A study of price movements over other periods shows the following variations:
Near a new HIGH record (1 year)
Type : Bullish
Timeframe : Weekly
Near a new HIGH record (1st january)
Type : Bullish
Timeframe : Weekly
Near a new HIGH record (1 month)
Type : Bullish
Timeframe : Weekly
Technical
A technical analysis in 1H of this CAC NEXT 20 chart shows a bearish trend. The signals given by moving averages are at 64.29% bearish. This bearish trend could slow down given the slightly bullish signals currently being given by short-term moving averages. The Central Indicators scanner does not detect any result on moving averages that would impact this trend.
An assessment of technical indicators does not currently provide any relevant information to suggest whether the signal given by the technical indicators is more bullish or bearish.
The Central Indicators scanner found this result concerning these indicators:
MACD crosses DOWN its Moving Average
Type : Bearish
Timeframe : 1 hour
The analysis of the price chart with Central Patterns scanners does not return any result.
The Central Candlesticks scanner currently notes the presence of this pattern in Japanese candlesticks that could mark the end of the short-term trend currently underway:
Black hanging man / hammer
Type : Neutral
Timeframe : 1 hour
| S3 | S2 | S1 | Price | R1 | R2 | R3 | |
|---|---|---|---|---|---|---|---|
| ProTrendLines | 10,786.87 | 10,882.64 | 11,009.16 | 11,010.49 | 11,076.21 | 11,151.55 | 11,245.12 |
| Change (%) | -2.03% | -1.16% | -0.01% | - | +0.60% | +1.28% | +2.13% |
| Change | -223.62 | -127.85 | -1.33 | - | +65.72 | +141.06 | +234.63 |
| Level | Intermediate | Major | Minor | - | Major | Intermediate | Minor |
Attention could also be paid to pivot points to set price objectives:
| Pivot points | S3 | S2 | S1 | PP | R1 | R2 | R3 |
|---|---|---|---|---|---|---|---|
| Standard | 10,850.15 | 10,908.90 | 10,959.70 | 11,018.45 | 11,069.25 | 11,128.00 | 11,178.80 |
| Camarilla | 10,980.36 | 10,990.41 | 11,000.45 | 11,010.49 | 11,020.53 | 11,030.57 | 11,040.62 |
| Woodie | 10,846.17 | 10,906.91 | 10,955.72 | 11,016.46 | 11,065.27 | 11,126.01 | 11,174.82 |
| Fibonacci | 10,908.90 | 10,950.75 | 10,976.61 | 11,018.45 | 11,060.30 | 11,086.16 | 11,128.00 |
| Pivot points | S3 | S2 | S1 | PP | R1 | R2 | R3 |
|---|---|---|---|---|---|---|---|
| Standard | 10,317.74 | 10,552.30 | 10,734.56 | 10,969.12 | 11,151.38 | 11,385.94 | 11,568.20 |
| Camarilla | 10,802.19 | 10,840.39 | 10,878.60 | 10,916.81 | 10,955.02 | 10,993.23 | 11,031.44 |
| Woodie | 10,291.58 | 10,539.23 | 10,708.40 | 10,956.05 | 11,125.22 | 11,372.87 | 11,542.04 |
| Fibonacci | 10,552.30 | 10,711.53 | 10,809.90 | 10,969.12 | 11,128.35 | 11,226.72 | 11,385.94 |
| Pivot points | S3 | S2 | S1 | PP | R1 | R2 | R3 |
|---|---|---|---|---|---|---|---|
| Standard | 10,178.24 | 10,462.36 | 10,964.61 | 11,248.73 | 11,750.98 | 12,035.10 | 12,537.35 |
| Camarilla | 11,250.61 | 11,322.69 | 11,394.78 | 11,466.86 | 11,538.94 | 11,611.03 | 11,683.11 |
| Woodie | 10,287.31 | 10,516.89 | 11,073.68 | 11,303.26 | 11,860.05 | 12,089.63 | 12,646.42 |
| Fibonacci | 10,462.36 | 10,762.75 | 10,948.34 | 11,248.73 | 11,549.12 | 11,734.71 | 12,035.10 |
Numerical data
The following is the status of the technical indicators and moving averages at the time of publication of this technical analysis:
| RSI (14): | 51.58 | |
| MACD (12,26,9): | 13.7200 | |
| Directional Movement: | 14.85 | |
| AROON (14): | 0 | |
| DEMA (21): | 11,025.71 | |
| Parabolic SAR (0,02-0,02-0,2): | 10,971.64 | |
| Elder Ray (13): | 4.16 | |
| Super Trend (3,10): | 10,942.20 | |
| Zig ZAG (10): | 11,010.49 | |
| VORTEX (21): | 0.9900 | |
| Stochastique (14,3,5): | 46.68 | |
| TEMA (21): | 11,042.07 | |
| Williams %R (14): | -60.90 | |
| Chande Momentum Oscillator (20): | 16.08 | |
| Repulse (5,40,3): | -0.3100 | |
| ROCnROLL: | 2 | |
| TRIX (15,9): | 0.0200 | |
| Courbe Coppock: | 0.50 |
| MA7: | 10,999.99 | |
| MA20: | 11,217.37 | |
| MA50: | 11,033.83 | |
| MA100: | 10,788.22 | |
| MAexp7: | 11,021.61 | |
| MAexp20: | 11,008.38 | |
| MAexp50: | 11,013.00 | |
| MAexp100: | 11,073.51 | |
| Price / MA7: | +0.10% | |
| Price / MA20: | -1.84% | |
| Price / MA50: | -0.21% | |
| Price / MA100: | +2.06% | |
| Price / MAexp7: | -0.10% | |
| Price / MAexp20: | +0.02% | |
| Price / MAexp50: | -0.02% | |
| Price / MAexp100: | -0.57% |
About author
Online


Add a comment
Comments
0 comments on the analysis CAC NEXT 20 - 1H