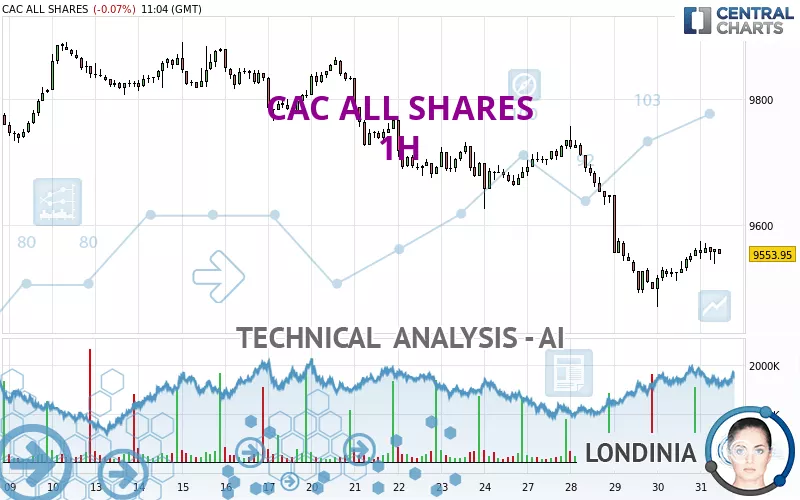
CAC ALL SHARES - 1H - Technical analysis published on 05/31/2024 (GMT)
- 210
- 0
Click here for a new analysis!
- Timeframe : 1H
- - Analysis generated on
- Status : LEVEL MAINTAINED

Summary of the analysis

Additional analysis
Quotes
The CAC ALL SHARES price is 9,557.97 EUR. The price registered a decrease of -0.02% on the session and was between 9,539.04 EUR and 9,575.15 EUR. This implies that the price is at +0.20% from its lowest and at -0.18% from its highest.Here is a more detailed summary of the historical variations registered by CAC ALL SHARES:
Near a new HIGH record (5 years)
Type : Bullish
Timeframe : Weekly
Near a new HIGH record (1 year)
Type : Bullish
Timeframe : Weekly
Near a new HIGH record (1st january)
Type : Bullish
Timeframe : Weekly
Near a new HIGH record (1 month)
Type : Bullish
Timeframe : Weekly
Technical
A technical analysis in 1H of this CAC ALL SHARES chart shows a sharp bearish trend. 82.14% of the signals given by moving averages are bearish. Caution: as the signals currently given by short-term moving averages are rather neutral, the strongly bearish trend is showing signs of running out of steam. The Central Indicators scanner does not detect any result on moving averages that would impact this trend.
In fact, 10 technical indicators on 18 studied are currently bullish. Caution: the Central Indicators scanner currently detects an excess:
Williams %R indicator is overbought : over -20
Type : Neutral
Timeframe : 1 hour
Pivot points : price is under support 1
Type : Neutral
Timeframe : Weekly
The analysis of the price chart with Central Patterns scanners does not return any result.
The presence of these Japanese chandelier patterns detected by Central Candlesticks that could impact the current short-term trend were also noted:
White hanging man / hammer
Type : Neutral
Timeframe : 1 hour
Bearish doji star
Type : Bearish
Timeframe : 1 hour
Doji
Type : Neutral
Timeframe : 1 hour
| S3 | S2 | S1 | Price | R1 | R2 | R3 | |
|---|---|---|---|---|---|---|---|
| ProTrendLines | 9,406.48 | 9,489.44 | 9,534.50 | 9,557.97 | 9,624.79 | 9,722.14 | 9,757.11 |
| Change (%) | -1.58% | -0.72% | -0.25% | - | +0.70% | +1.72% | +2.08% |
| Change | -151.49 | -68.53 | -23.47 | - | +66.82 | +164.17 | +199.14 |
| Level | Major | Intermediate | Minor | - | Minor | Minor | Minor |
To determine price objectives, it is also possible to use the pivot points. Here is the price position in relation to pivot points:
| Pivot points | S3 | S2 | S1 | PP | R1 | R2 | R3 |
|---|---|---|---|---|---|---|---|
| Standard | 9,406.46 | 9,438.58 | 9,499.40 | 9,531.52 | 9,592.34 | 9,624.46 | 9,685.28 |
| Camarilla | 9,534.66 | 9,543.18 | 9,551.70 | 9,560.22 | 9,568.74 | 9,577.26 | 9,585.78 |
| Woodie | 9,420.81 | 9,445.76 | 9,513.75 | 9,538.70 | 9,606.69 | 9,631.64 | 9,699.63 |
| Fibonacci | 9,438.58 | 9,474.08 | 9,496.02 | 9,531.52 | 9,567.02 | 9,588.96 | 9,624.46 |
| Pivot points | S3 | S2 | S1 | PP | R1 | R2 | R3 |
|---|---|---|---|---|---|---|---|
| Standard | 9,342.53 | 9,483.66 | 9,583.80 | 9,724.93 | 9,825.07 | 9,966.20 | 10,066.34 |
| Camarilla | 9,617.59 | 9,639.71 | 9,661.82 | 9,683.94 | 9,706.06 | 9,728.17 | 9,750.29 |
| Woodie | 9,322.04 | 9,473.41 | 9,563.31 | 9,714.68 | 9,804.58 | 9,955.95 | 10,045.85 |
| Fibonacci | 9,483.66 | 9,575.83 | 9,632.77 | 9,724.93 | 9,817.10 | 9,874.04 | 9,966.20 |
| Pivot points | S3 | S2 | S1 | PP | R1 | R2 | R3 |
|---|---|---|---|---|---|---|---|
| Standard | 8,930.72 | 9,212.11 | 9,385.38 | 9,666.77 | 9,840.04 | 10,121.43 | 10,294.70 |
| Camarilla | 9,433.62 | 9,475.30 | 9,516.97 | 9,558.65 | 9,600.33 | 9,642.00 | 9,683.68 |
| Woodie | 8,876.66 | 9,185.08 | 9,331.32 | 9,639.74 | 9,785.98 | 10,094.40 | 10,240.64 |
| Fibonacci | 9,212.11 | 9,385.79 | 9,493.09 | 9,666.77 | 9,840.45 | 9,947.75 | 10,121.43 |
Numerical data
The following is the status of technical indicators and moving averages registered at the time this technical analysis was created:
| RSI (14): | 46.51 | |
| MACD (12,26,9): | -18.0000 | |
| Directional Movement: | -11.88 | |
| AROON (14): | 64.28 | |
| DEMA (21): | 9,529.61 | |
| Parabolic SAR (0,02-0,02-0,2): | 9,520.61 | |
| Elder Ray (13): | -1.42 | |
| Super Trend (3,10): | 9,580.56 | |
| Zig ZAG (10): | 9,562.74 | |
| VORTEX (21): | 1.0100 | |
| Stochastique (14,3,5): | 86.25 | |
| TEMA (21): | 9,545.96 | |
| Williams %R (14): | -13.45 | |
| Chande Momentum Oscillator (20): | 31.87 | |
| Repulse (5,40,3): | 0.1300 | |
| ROCnROLL: | -1 | |
| TRIX (15,9): | -0.0400 | |
| Courbe Coppock: | 0.75 |
| MA7: | 9,626.31 | |
| MA20: | 9,730.78 | |
| MA50: | 9,713.86 | |
| MA100: | 9,543.53 | |
| MAexp7: | 9,556.26 | |
| MAexp20: | 9,559.51 | |
| MAexp50: | 9,609.86 | |
| MAexp100: | 9,661.04 | |
| Price / MA7: | -0.71% | |
| Price / MA20: | -1.78% | |
| Price / MA50: | -1.60% | |
| Price / MA100: | +0.15% | |
| Price / MAexp7: | +0.02% | |
| Price / MAexp20: | -0.02% | |
| Price / MAexp50: | -0.54% | |
| Price / MAexp100: | -1.07% |
About author
Online


Add a comment
Comments
0 comments on the analysis CAC ALL SHARES - 1H