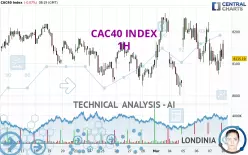
CAC40 INDEX - 1H - Technical analysis published on 03/10/2025 (GMT)
- 122
- 0
Click here for a new analysis!
- Timeframe : 1H
- - Analysis generated on
- Status : TARGET REACHED

Summary of the analysis

Additional analysis
Quotes
The CAC40 INDEX price is 8,115.19 EUR. The price registered a decrease of -0.07% on the session and was between 8,114.51 EUR and 8,174.59 EUR. This implies that the price is at +0.01% from its lowest and at -0.73% from its highest.The Central Gaps scanner detects a bullish opening. A small advantage for buyers in the very short term.
Bullish opening
Type : Bullish
Timeframe : Openning
A study of price movements over other periods shows the following variations:
Near a new HIGH record (5 years)
Type : Bullish
Timeframe : Weekly
Near a new HIGH record (1 year)
Type : Bullish
Timeframe : Weekly
Near a new HIGH record (1st january)
Type : Bullish
Timeframe : Weekly
Near a new LOW record (1 month)
Type : Bearish
Timeframe : Weekly
Technical
A technical analysis in 1H of this CAC40 INDEX chart shows a slightly bearish trend. Only 60.71% of the signals given by moving averages are bearish. This slightly bearish trend is reinforced by the strong signals currently being given by short-term moving averages. The Central Indicators market scanner is currently detecting several bullish signals that could impact this trend:
Bullish price crossover with Moving Average 20
Type : Bullish
Timeframe : 1 hour
Bullish price crossover with Moving Average 50
Type : Bullish
Timeframe : 1 hour
Bullish price crossover with Moving Average 100
Type : Bullish
Timeframe : 1 hour
Bullish price crossover with adaptative moving average 20
Type : Bullish
Timeframe : 1 hour
Bullish price crossover with adaptative moving average 50
Type : Bullish
Timeframe : 1 hour
Bullish price crossover with adaptative moving average 100
Type : Bullish
Timeframe : 1 hour
The technical indicators are generally neutral. They do not provide relevant information on the direction of future price movements.
Central Indicators, the detector scanner for these technical indicators has recently detected several signals:
RSI indicator is back over 50
Type : Bullish
Timeframe : 1 hour
Ichimoku : price is over the cloud
Type : Bullish
Timeframe : 1 hour
The analysis of the price chart with Central Patterns scanners does not return any result.
No result was found by the Central Candlesticks scanner on Japanese candlesticks.
| S3 | S2 | S1 | Price | R1 | R2 | |
|---|---|---|---|---|---|---|
| ProTrendLines | 8,001.39 | 8,048.88 | 8,096.02 | 8,115.19 | 8,168.20 | 8,239.99 |
| Change (%) | -1.40% | -0.82% | -0.24% | - | +0.65% | +1.54% |
| Change | -113.80 | -66.31 | -19.17 | - | +53.01 | +124.80 |
| Level | Major | Major | Intermediate | - | Minor | Major |
Pivot points can also be used to set your price objectives. Here is the price situation in relation to pivot points:
| Pivot points | S3 | S2 | S1 | PP | R1 | R2 | R3 |
|---|---|---|---|---|---|---|---|
| Standard | 7,953.65 | 8,009.90 | 8,065.35 | 8,121.60 | 8,177.05 | 8,233.30 | 8,288.75 |
| Camarilla | 8,090.08 | 8,100.32 | 8,110.56 | 8,120.80 | 8,131.04 | 8,141.28 | 8,151.52 |
| Woodie | 7,953.25 | 8,009.70 | 8,064.95 | 8,121.40 | 8,176.65 | 8,233.10 | 8,288.35 |
| Fibonacci | 8,009.90 | 8,052.57 | 8,078.93 | 8,121.60 | 8,164.27 | 8,190.63 | 8,233.30 |
| Pivot points | S3 | S2 | S1 | PP | R1 | R2 | R3 |
|---|---|---|---|---|---|---|---|
| Standard | 7,738.61 | 7,869.88 | 7,995.34 | 8,126.61 | 8,252.07 | 8,383.34 | 8,508.80 |
| Camarilla | 8,050.20 | 8,073.73 | 8,097.27 | 8,120.80 | 8,144.33 | 8,167.87 | 8,191.40 |
| Woodie | 7,735.71 | 7,868.43 | 7,992.44 | 8,125.16 | 8,249.17 | 8,381.89 | 8,505.90 |
| Fibonacci | 7,869.88 | 7,967.95 | 8,028.54 | 8,126.61 | 8,224.68 | 8,285.27 | 8,383.34 |
| Pivot points | S3 | S2 | S1 | PP | R1 | R2 | R3 |
|---|---|---|---|---|---|---|---|
| Standard | 7,417.36 | 7,601.62 | 7,856.62 | 8,040.88 | 8,295.88 | 8,480.14 | 8,735.14 |
| Camarilla | 7,990.83 | 8,031.10 | 8,071.37 | 8,111.63 | 8,151.90 | 8,192.16 | 8,232.43 |
| Woodie | 7,452.74 | 7,619.31 | 7,892.00 | 8,058.57 | 8,331.26 | 8,497.83 | 8,770.52 |
| Fibonacci | 7,601.62 | 7,769.41 | 7,873.08 | 8,040.88 | 8,208.67 | 8,312.34 | 8,480.14 |
Numerical data
The following is the status of technical indicators and moving averages registered at the time this technical analysis was created:
| RSI (14): | 47.75 | |
| MACD (12,26,9): | -9.0300 | |
| Directional Movement: | -2.98 | |
| AROON (14): | -57.14 | |
| DEMA (21): | 8,123.94 | |
| Parabolic SAR (0,02-0,02-0,2): | 8,196.14 | |
| Elder Ray (13): | -0.63 | |
| Super Trend (3,10): | 8,223.59 | |
| Zig ZAG (10): | 8,120.80 | |
| VORTEX (21): | 0.9200 | |
| Stochastique (14,3,5): | 34.46 | |
| TEMA (21): | 8,112.37 | |
| Williams %R (14): | -54.25 | |
| Chande Momentum Oscillator (20): | -19.17 | |
| Repulse (5,40,3): | 0.0200 | |
| ROCnROLL: | 2 | |
| TRIX (15,9): | -0.0100 | |
| Courbe Coppock: | 0.91 |
| MA7: | 8,136.29 | |
| MA20: | 8,122.16 | |
| MA50: | 7,849.86 | |
| MA100: | 7,604.69 | |
| MAexp7: | 8,120.34 | |
| MAexp20: | 8,133.10 | |
| MAexp50: | 8,136.13 | |
| MAexp100: | 8,126.91 | |
| Price / MA7: | -0.26% | |
| Price / MA20: | -0.09% | |
| Price / MA50: | +3.38% | |
| Price / MA100: | +6.71% | |
| Price / MAexp7: | -0.06% | |
| Price / MAexp20: | -0.22% | |
| Price / MAexp50: | -0.26% | |
| Price / MAexp100: | -0.14% |
News
Don't forget to follow the news on CAC40 INDEX. At the time of publication of this analysis, the latest news was as follows:
-
 CAC 40 Outlook - On the Precipice of a Big Move?
-
CAC Forecast - Paris Index to Roll Over? (December 16, 2024)
-
CAC Forecast December 5, 2024
-
CAC 40 Forecast November 1, 2024
-
CAC 40 Forecast October 25, 2024
About author
Online


Add a comment
Comments
0 comments on the analysis CAC40 INDEX - 1H