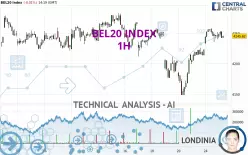
BEL20 INDEX - 1H - Technical analysis published on 12/27/2024 (GMT)
- 112
- 0
Click here for a new analysis!
- Timeframe : 1H
- - Analysis generated on
- Status : TARGET REACHED

Summary of the analysis

Additional analysis
Quotes
The BEL20 INDEX price is 4,245.62 EUR. On the day, this instrument lost -0.01% and was between 4,235.65 EUR and 4,253.61 EUR. This implies that the price is at +0.24% from its lowest and at -0.19% from its highest.Here is a more detailed summary of the historical variations registered by BEL20 INDEX:
Near a new HIGH record (5 years)
Type : Bullish
Timeframe : Weekly
Near a new HIGH record (1 year)
Type : Bullish
Timeframe : Weekly
Near a new HIGH record (1st january)
Type : Bullish
Timeframe : Weekly
Near a new LOW record (1 month)
Type : Bearish
Timeframe : Weekly
Technical
Technical analysis of this 1H chart of BEL20 INDEX indicates that the overall trend is bullish. 67.86% of the signals given by moving averages are bullish. The overall trend is reinforced by the strong bullish signals from short-term moving averages. An assessment of moving averages reveals a bearish signal that could impact this trend:
Bearish trend reversal : Moving Average 100
Type : Bearish
Timeframe : 1 hour
In fact, according to the parameters integrated into the Central Analyzer system, only 9 technical indicators out of 18 analysed are currently bullish. Central Indicators, the detector scanner for these technical indicators has recently detected several signals:
MACD crosses DOWN its Moving Average
Type : Bearish
Timeframe : 1 hour
Price is back over the pivot point
Type : Bullish
Timeframe : Weekly
Price is back under the pivot point
Type : Bearish
Timeframe : 1 hour
Momentum indicator is back under 0
Type : Bearish
Timeframe : 1 hour
No signals are given by Central Patterns, a market scanner specialised in chart patterns, resistances and supports.
The presence of these Japanese chandelier patterns detected by Central Candlesticks that could impact the current short-term trend were also noted:
Bullish doji star
Type : Bullish
Timeframe : 1 hour
Downside gap
Type : Bearish
Timeframe : 1 hour
Doji
Type : Neutral
Timeframe : 1 hour
Bearish engulfing lines
Type : Bearish
Timeframe : 1 hour
| S3 | S2 | S1 | Price | R1 | R2 | R3 | |
|---|---|---|---|---|---|---|---|
| ProTrendLines | 4,184.02 | 4,201.20 | 4,222.32 | 4,245.62 | 4,268.56 | 4,278.91 | 4,331.62 |
| Change (%) | -1.45% | -1.05% | -0.55% | - | +0.54% | +0.78% | +2.03% |
| Change | -61.60 | -44.42 | -23.30 | - | +22.94 | +33.29 | +86.00 |
| Level | Major | Minor | Major | - | Intermediate | Minor | Intermediate |
Pivot points can also be used to set your price objectives. Here is the price situation in relation to pivot points:
| Pivot points | S3 | S2 | S1 | PP | R1 | R2 | R3 |
|---|---|---|---|---|---|---|---|
| Standard | 4,206.55 | 4,219.24 | 4,232.65 | 4,245.34 | 4,258.75 | 4,271.44 | 4,284.85 |
| Camarilla | 4,238.87 | 4,241.27 | 4,243.66 | 4,246.05 | 4,248.44 | 4,250.84 | 4,253.23 |
| Woodie | 4,206.90 | 4,219.42 | 4,233.00 | 4,245.52 | 4,259.10 | 4,271.62 | 4,285.20 |
| Fibonacci | 4,219.24 | 4,229.21 | 4,235.37 | 4,245.34 | 4,255.31 | 4,261.47 | 4,271.44 |
| Pivot points | S3 | S2 | S1 | PP | R1 | R2 | R3 |
|---|---|---|---|---|---|---|---|
| Standard | 4,032.86 | 4,090.59 | 4,152.41 | 4,210.14 | 4,271.96 | 4,329.69 | 4,391.51 |
| Camarilla | 4,181.34 | 4,192.30 | 4,203.26 | 4,214.22 | 4,225.18 | 4,236.14 | 4,247.10 |
| Woodie | 4,034.90 | 4,091.61 | 4,154.45 | 4,211.16 | 4,274.00 | 4,330.71 | 4,393.55 |
| Fibonacci | 4,090.59 | 4,136.26 | 4,164.48 | 4,210.14 | 4,255.81 | 4,284.03 | 4,329.69 |
| Pivot points | S3 | S2 | S1 | PP | R1 | R2 | R3 |
|---|---|---|---|---|---|---|---|
| Standard | 3,839.49 | 3,965.86 | 4,096.58 | 4,222.95 | 4,353.67 | 4,480.04 | 4,610.76 |
| Camarilla | 4,156.61 | 4,180.18 | 4,203.74 | 4,227.31 | 4,250.88 | 4,274.44 | 4,298.01 |
| Woodie | 3,841.68 | 3,966.95 | 4,098.77 | 4,224.04 | 4,355.86 | 4,481.13 | 4,612.95 |
| Fibonacci | 3,965.86 | 4,064.07 | 4,124.74 | 4,222.95 | 4,321.16 | 4,381.83 | 4,480.04 |
Numerical data
The following are the details of the technical indicators and moving averages that were collected to generate this technical analysis:
| RSI (14): | 57.49 | |
| MACD (12,26,9): | 9.6500 | |
| Directional Movement: | 7.23 | |
| AROON (14): | 42.86 | |
| DEMA (21): | 4,249.45 | |
| Parabolic SAR (0,02-0,02-0,2): | 4,255.48 | |
| Elder Ray (13): | 1.02 | |
| Super Trend (3,10): | 4,222.45 | |
| Zig ZAG (10): | 4,245.15 | |
| VORTEX (21): | 1.1900 | |
| Stochastique (14,3,5): | 74.32 | |
| TEMA (21): | 4,256.81 | |
| Williams %R (14): | -29.43 | |
| Chande Momentum Oscillator (20): | 0.93 | |
| Repulse (5,40,3): | -0.0300 | |
| ROCnROLL: | 1 | |
| TRIX (15,9): | 0.0400 | |
| Courbe Coppock: | 1.16 |
| MA7: | 4,232.19 | |
| MA20: | 4,239.36 | |
| MA50: | 4,240.05 | |
| MA100: | 4,217.32 | |
| MAexp7: | 4,246.10 | |
| MAexp20: | 4,237.01 | |
| MAexp50: | 4,229.19 | |
| MAexp100: | 4,229.35 | |
| Price / MA7: | +0.32% | |
| Price / MA20: | +0.15% | |
| Price / MA50: | +0.13% | |
| Price / MA100: | +0.67% | |
| Price / MAexp7: | -0.01% | |
| Price / MAexp20: | +0.20% | |
| Price / MAexp50: | +0.39% | |
| Price / MAexp100: | +0.38% |
About author
Online


Add a comment
Comments
0 comments on the analysis BEL20 INDEX - 1H