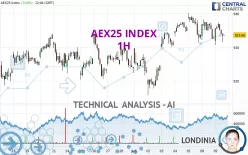
AEX25 INDEX - 1H - Technical analysis published on 07/09/2024 (GMT)
- 223
- 0
Click here for a new analysis!
- Timeframe : 1H
- - Analysis generated on
- Status : INVALID

Summary of the analysis

Additional analysis
Quotes
The AEX25 INDEX price is 932.27 EUR. On the day, this instrument lost -0.06% with the lowest point at 930.70 EUR and the highest point at 937.30 EUR. The deviation from the price is +0.17% for the low point and -0.54% for the high point.The Central Gaps scanner detects the formation of a bearish gap marking the strong presence of sellers ahead of buyers at the opening. This formed a quotation gap.
Opening Gap DOWN
Type : Bearish
Timeframe : Openning
So that you have an overall view of the price change, here is a table showing the variations over several periods:
Near a new HIGH record (5 years)
Type : Bullish
Timeframe : Weekly
Near a new HIGH record (1 year)
Type : Bullish
Timeframe : Weekly
Near a new HIGH record (1st january)
Type : Bullish
Timeframe : Weekly
Near a new LOW record (1 month)
Type : Bearish
Timeframe : Weekly
Technical
Technical analysis of this 1H chart of AEX25 INDEX indicates that the overall trend is slightly bullish. 57.14% of the signals given by moving averages are bullish. Caution: the strong bearish signals currently being given by short-term moving averages indicate that this slightly bullish trend could be reversed. An assessment of moving averages reveals several bearish signals that could impact this trend:
Bearish price crossover with Moving Average 50
Type : Bearish
Timeframe : 1 hour
Bearish price crossover with adaptative moving average 50
Type : Bearish
Timeframe : 1 hour
The probability of a further decline is moderate given the direction of the technical indicators.
Caution: the Central Indicators scanner currently detects an excess:
CCI indicator is oversold : under -100
Type : Neutral
Timeframe : 1 hour
Williams %R indicator is oversold : under -80
Type : Neutral
Timeframe : 1 hour
SuperTrend indicator bearish reversal
Type : Bearish
Timeframe : 1 hour
Central Patterns, the scanner specializing in chart patterns, did not identify any signals.
The Central Candlesticks scanner, specialised in Japanese candlesticks, did not identify any signals.
| S3 | S2 | S1 | Price | R1 | R2 | R3 | |
|---|---|---|---|---|---|---|---|
| ProTrendLines | 920.48 | 927.89 | 931.32 | 932.27 | 933.84 | 938.30 | 940.16 |
| Change (%) | -1.26% | -0.47% | -0.10% | - | +0.17% | +0.65% | +0.85% |
| Change | -11.79 | -4.38 | -0.95 | - | +1.57 | +6.03 | +7.89 |
| Level | Intermediate | Minor | Minor | - | Major | Minor | Minor |
Pivot points can also be used to set your price objectives. Here is the price situation in relation to pivot points:
| Pivot points | S3 | S2 | S1 | PP | R1 | R2 | R3 |
|---|---|---|---|---|---|---|---|
| Standard | 924.42 | 928.28 | 930.57 | 934.43 | 936.72 | 940.58 | 942.87 |
| Camarilla | 931.16 | 931.72 | 932.29 | 932.85 | 933.41 | 933.98 | 934.54 |
| Woodie | 923.63 | 927.89 | 929.78 | 934.04 | 935.93 | 940.19 | 942.08 |
| Fibonacci | 928.28 | 930.63 | 932.08 | 934.43 | 936.78 | 938.23 | 940.58 |
| Pivot points | S3 | S2 | S1 | PP | R1 | R2 | R3 |
|---|---|---|---|---|---|---|---|
| Standard | 895.31 | 905.56 | 919.66 | 929.91 | 944.01 | 954.26 | 968.36 |
| Camarilla | 927.06 | 929.30 | 931.53 | 933.76 | 935.99 | 938.22 | 940.46 |
| Woodie | 897.24 | 906.52 | 921.59 | 930.87 | 945.94 | 955.22 | 970.29 |
| Fibonacci | 905.56 | 914.86 | 920.61 | 929.91 | 939.21 | 944.96 | 954.26 |
| Pivot points | S3 | S2 | S1 | PP | R1 | R2 | R3 |
|---|---|---|---|---|---|---|---|
| Standard | 865.93 | 881.81 | 902.83 | 918.71 | 939.73 | 955.61 | 976.63 |
| Camarilla | 913.70 | 917.09 | 920.47 | 923.85 | 927.23 | 930.62 | 934.00 |
| Woodie | 868.50 | 883.10 | 905.40 | 920.00 | 942.30 | 956.90 | 979.20 |
| Fibonacci | 881.81 | 895.91 | 904.61 | 918.71 | 932.81 | 941.51 | 955.61 |
Numerical data
The following is the status of technical indicators and moving averages registered at the time this technical analysis was created:
| RSI (14): | 41.97 | |
| MACD (12,26,9): | 0.0300 | |
| Directional Movement: | -8.28 | |
| AROON (14): | -57.15 | |
| DEMA (21): | 935.24 | |
| Parabolic SAR (0,02-0,02-0,2): | 937.57 | |
| Elder Ray (13): | -1.84 | |
| Super Trend (3,10): | 939.36 | |
| Zig ZAG (10): | 931.58 | |
| VORTEX (21): | 0.8600 | |
| Stochastique (14,3,5): | 39.21 | |
| TEMA (21): | 934.01 | |
| Williams %R (14): | -86.58 | |
| Chande Momentum Oscillator (20): | -5.64 | |
| Repulse (5,40,3): | -0.4500 | |
| ROCnROLL: | 2 | |
| TRIX (15,9): | 0.0100 | |
| Courbe Coppock: | 0.27 |
| MA7: | 930.28 | |
| MA20: | 927.37 | |
| MA50: | 915.78 | |
| MA100: | 891.39 | |
| MAexp7: | 934.28 | |
| MAexp20: | 934.86 | |
| MAexp50: | 933.21 | |
| MAexp100: | 930.51 | |
| Price / MA7: | +0.21% | |
| Price / MA20: | +0.53% | |
| Price / MA50: | +1.80% | |
| Price / MA100: | +4.59% | |
| Price / MAexp7: | -0.22% | |
| Price / MAexp20: | -0.28% | |
| Price / MAexp50: | -0.10% | |
| Price / MAexp100: | +0.19% |
News
The latest news and videos published on AEX25 INDEX at the time of the analysis were as follows:
About author
Online


Add a comment
Comments
0 comments on the analysis AEX25 INDEX - 1H