| Open: | - |
| Change: | - |
| Volume: | - |
| Low: | - |
| High: | - |
| High / Low range: | - |
| Type: | Indices |
| Ticker: | AEX |
| ISIN: | NL0000000107 |
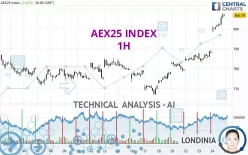
AEX25 INDEX - 1H - Technical analysis published on 01/24/2024 (GMT)
- 204
- 0
- 01/24/2024 - 16:25
Click here for a new analysis!
- Timeframe : 1H
- - Analysis generated on 01/24/2024 - 16:25
- Status : TARGET REACHED

Summary of the analysis

Additional analysis
Quotes
The AEX25 INDEX price is 806.47 EUR. The price has increased by +2.37% since the last closing and was traded between 798.43 EUR and 807.93 EUR over the period. The price is currently at +1.01% from its lowest and -0.18% from its highest.The Central Gaps scanner detects the formation of a bullish gap marking the strong presence of buyers against sellers at the opening. This formed a quotation gap.
Opening Gap UP
Type : Bullish
Timeframe : Openning
So that you have an overall view of the price change, here is a table showing the variations over several periods:
Near a new HIGH record (5 years)
Type : Bullish
Timeframe : Weekly
New HIGH record (1 year)
Type : Bullish
Timeframe : Weekly
New HIGH record (1st january)
Type : Bullish
Timeframe : Weekly
New HIGH record (1 month)
Type : Bullish
Timeframe : Weekly
Technical
A technical analysis in 1H of this AEX25 INDEX chart shows a strongly bullish trend. 92.86% of the signals given by moving averages are bullish. The overall trend is supported by the strong bullish signals from short-term moving averages. There is no crossing of moving average by the price or crossing of moving averages between themselves.
The probability of a further increase is high given the direction of the technical indicators.
Caution: the Central Indicators scanner currently detects an excess:
RSI indicator is overbought : over 80
Type : Neutral
Timeframe : 1 hour
CCI indicator is overbought : over 100
Type : Neutral
Timeframe : 1 hour
Williams %R indicator is overbought : over -20
Type : Neutral
Timeframe : 1 hour
Pivot points : price is over resistance 3
Type : Neutral
Timeframe : 1 hour
Pivot points : price is over resistance 3
Type : Neutral
Timeframe : Weekly
Central Patterns, the scanner specializing in chart patterns, did not identify any signals.
The Central Candlesticks scanner which studies Japanese candlesticks did not detect anything.
| S3 | S2 | S1 | Price | R1 | |
|---|---|---|---|---|---|
| ProTrendLines | 785.36 | 788.08 | 794.15 | 806.47 | 827.57 |
| Change (%) | -2.62% | -2.28% | -1.53% | - | +2.62% |
| Change | -21.11 | -18.39 | -12.32 | - | +21.10 |
| Level | Intermediate | Intermediate | Major | - | Major |
Pivot points can also be used to set your price objectives. Here is the price situation in relation to pivot points:
| Pivot points | S3 | S2 | S1 | PP | R1 | R2 | R3 |
|---|---|---|---|---|---|---|---|
| Standard | 777.85 | 780.48 | 784.12 | 786.75 | 790.39 | 793.02 | 796.66 |
| Camarilla | 786.05 | 786.62 | 787.20 | 787.77 | 788.35 | 788.92 | 789.49 |
| Woodie | 778.37 | 780.73 | 784.64 | 787.00 | 790.91 | 793.27 | 797.18 |
| Fibonacci | 780.48 | 782.87 | 784.35 | 786.75 | 789.14 | 790.62 | 793.02 |
| Pivot points | S3 | S2 | S1 | PP | R1 | R2 | R3 |
|---|---|---|---|---|---|---|---|
| Standard | 750.43 | 758.54 | 768.72 | 776.83 | 787.01 | 795.12 | 805.30 |
| Camarilla | 773.86 | 775.54 | 777.21 | 778.89 | 780.57 | 782.24 | 783.92 |
| Woodie | 751.46 | 759.06 | 769.75 | 777.35 | 788.04 | 795.64 | 806.33 |
| Fibonacci | 758.54 | 765.53 | 769.85 | 776.83 | 783.82 | 788.14 | 795.12 |
| Pivot points | S3 | S2 | S1 | PP | R1 | R2 | R3 |
|---|---|---|---|---|---|---|---|
| Standard | 739.49 | 753.47 | 770.14 | 784.12 | 800.79 | 814.77 | 831.44 |
| Camarilla | 778.39 | 781.20 | 784.01 | 786.82 | 789.63 | 792.44 | 795.25 |
| Woodie | 740.85 | 754.14 | 771.50 | 784.79 | 802.15 | 815.44 | 832.80 |
| Fibonacci | 753.47 | 765.18 | 772.41 | 784.12 | 795.83 | 803.06 | 814.77 |
Numerical data
The following is the status of the technical indicators and moving averages at the time of publication of this technical analysis:
| RSI (14): | 86.90 | |
| MACD (12,26,9): | 6.3500 | |
| Directional Movement: | 47.16 | |
| AROON (14): | 92.86 | |
| DEMA (21): | 803.81 | |
| Parabolic SAR (0,02-0,02-0,2): | 797.10 | |
| Elder Ray (13): | 7.59 | |
| Super Trend (3,10): | 799.82 | |
| Zig ZAG (10): | 807.24 | |
| VORTEX (21): | 1.2400 | |
| Stochastique (14,3,5): | 96.55 | |
| TEMA (21): | 807.09 | |
| Williams %R (14): | -4.19 | |
| Chande Momentum Oscillator (20): | 20.41 | |
| Repulse (5,40,3): | 0.3700 | |
| ROCnROLL: | 1 | |
| TRIX (15,9): | 0.0900 | |
| Courbe Coppock: | 4.64 |
| MA7: | 783.84 | |
| MA20: | 781.89 | |
| MA50: | 776.54 | |
| MA100: | 754.00 | |
| MAexp7: | 803.32 | |
| MAexp20: | 796.04 | |
| MAexp50: | 788.34 | |
| MAexp100: | 784.48 | |
| Price / MA7: | +2.89% | |
| Price / MA20: | +3.14% | |
| Price / MA50: | +3.85% | |
| Price / MA100: | +6.96% | |
| Price / MAexp7: | +0.39% | |
| Price / MAexp20: | +1.31% | |
| Price / MAexp50: | +2.30% | |
| Price / MAexp100: | +2.80% |
News
The latest news and videos published on AEX25 INDEX at the time of the analysis were as follows:
-
04/15/2018 - 12:50
 AEX Review by FXEmpire
About author
Online


Add a comment
Comments
0 comments on the analysis AEX25 INDEX - 1H