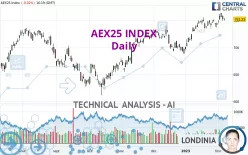
AEX25 INDEX - Daily - Technical analysis published on 02/07/2023 (GMT)
- 234
- 0
Click here for a new analysis!
- Timeframe : Daily
- - Analysis generated on
- Status : LEVEL MAINTAINED

Summary of the analysis

Additional analysis
Quotes
The AEX25 INDEX price is 752.23 EUR. On the day, this instrument lost -0.02% with the lowest point at 749.34 EUR and the highest point at 754.46 EUR. The deviation from the price is +0.39% for the low point and -0.30% for the high point.The Central Gaps scanner detects a bullish opening. A small advantage for buyers in the very short term.
Bullish opening
Type : Bullish
Timeframe : Openning
So that you have an overall view of the price change, here is a table showing the variations over several periods:
Near a new HIGH record (1 year)
Type : Bullish
Timeframe : Weekly
Near a new HIGH record (1st january)
Type : Bullish
Timeframe : Weekly
Near a new LOW record (1 month)
Type : Bearish
Timeframe : Weekly
Technical
Technical analysis of this Daily chart of AEX25 INDEX indicates that the overall trend is strongly bullish. 92.86% of the signals given by moving averages are bullish. This strongly bullish trend is supported by the strong bullish signals given by short-term moving averages. There is no crossing of moving average by the price or crossing of moving averages between themselves.
An assessment of technical indicators shows a moderate bullish signal.
Central Indicators, the scanner specialised in technical indicators, has identified these signals:
MACD crosses DOWN its Moving Average
Type : Bearish
Timeframe : Daily
Price is back under the pivot point
Type : Bearish
Timeframe : Weekly
The analysis of the price chart with Central Patterns scanners does not return any result.
The Central Candlesticks scanner, specialised in Japanese candlesticks, did not identify any signals.
| S3 | S2 | S1 | Price | R1 | |
|---|---|---|---|---|---|
| ProTrendLines | 666.68 | 689.01 | 734.53 | 752.23 | 827.57 |
| Change (%) | -11.37% | -8.40% | -2.35% | - | +10.02% |
| Change | -85.55 | -63.22 | -17.70 | - | +75.34 |
| Level | Minor | Minor | Major | - | Major |
Attention could also be paid to pivot points to set price objectives:
| Pivot points | S3 | S2 | S1 | PP | R1 | R2 | R3 |
|---|---|---|---|---|---|---|---|
| Standard | 738.87 | 744.23 | 748.31 | 753.67 | 757.75 | 763.11 | 767.19 |
| Camarilla | 749.80 | 750.67 | 751.54 | 752.40 | 753.27 | 754.13 | 755.00 |
| Woodie | 738.24 | 743.91 | 747.68 | 753.35 | 757.12 | 762.79 | 766.56 |
| Fibonacci | 744.23 | 747.83 | 750.06 | 753.67 | 757.27 | 759.50 | 763.11 |
| Pivot points | S3 | S2 | S1 | PP | R1 | R2 | R3 |
|---|---|---|---|---|---|---|---|
| Standard | 718.68 | 727.71 | 745.79 | 754.82 | 772.90 | 781.93 | 800.01 |
| Camarilla | 756.41 | 758.89 | 761.38 | 763.86 | 766.35 | 768.83 | 771.32 |
| Woodie | 723.20 | 729.97 | 750.31 | 757.08 | 777.42 | 784.19 | 804.53 |
| Fibonacci | 727.71 | 738.07 | 744.47 | 754.82 | 765.18 | 771.58 | 781.93 |
| Pivot points | S3 | S2 | S1 | PP | R1 | R2 | R3 |
|---|---|---|---|---|---|---|---|
| Standard | 647.11 | 670.87 | 708.03 | 731.79 | 768.95 | 792.71 | 829.87 |
| Camarilla | 728.44 | 734.02 | 739.61 | 745.19 | 750.77 | 756.36 | 761.94 |
| Woodie | 653.81 | 674.22 | 714.73 | 735.14 | 775.65 | 796.06 | 836.57 |
| Fibonacci | 670.87 | 694.14 | 708.52 | 731.79 | 755.06 | 769.44 | 792.71 |
Numerical data
The following is the status of the technical indicators and moving averages at the time of publication of this technical analysis:
| RSI (14): | 57.77 | |
| MACD (12,26,9): | 8.5600 | |
| Directional Movement: | 9.02 | |
| AROON (14): | 50.00 | |
| DEMA (21): | 756.36 | |
| Parabolic SAR (0,02-0,02-0,2): | 737.76 | |
| Elder Ray (13): | 2.80 | |
| Super Trend (3,10): | 732.33 | |
| Zig ZAG (10): | 751.76 | |
| VORTEX (21): | 1.0100 | |
| Stochastique (14,3,5): | 72.74 | |
| TEMA (21): | 757.52 | |
| Williams %R (14): | -41.55 | |
| Chande Momentum Oscillator (20): | 13.23 | |
| Repulse (5,40,3): | 0.3700 | |
| ROCnROLL: | 1 | |
| TRIX (15,9): | 0.1800 | |
| Courbe Coppock: | 2.36 |
| MA7: | 752.12 | |
| MA20: | 747.35 | |
| MA50: | 727.72 | |
| MA100: | 698.81 | |
| MAexp7: | 752.60 | |
| MAexp20: | 744.71 | |
| MAexp50: | 728.92 | |
| MAexp100: | 714.36 | |
| Price / MA7: | +0.01% | |
| Price / MA20: | +0.65% | |
| Price / MA50: | +3.37% | |
| Price / MA100: | +7.64% | |
| Price / MAexp7: | -0.05% | |
| Price / MAexp20: | +1.01% | |
| Price / MAexp50: | +3.20% | |
| Price / MAexp100: | +5.30% |
News
The latest news and videos published on AEX25 INDEX at the time of the analysis were as follows:
About author
Online


Add a comment
Comments
0 comments on the analysis AEX25 INDEX - Daily