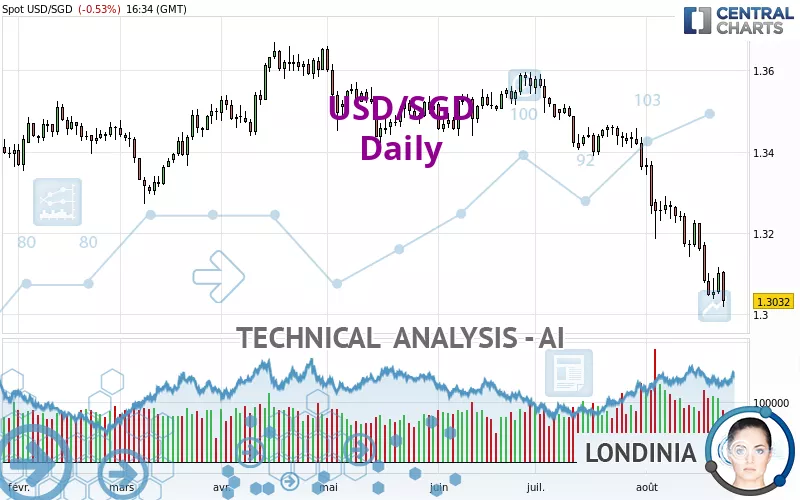
USD/SGD - Daily - Technical analysis published on 08/23/2024 (GMT)
- 136
- 0
Click here for a new analysis!
- Timeframe : Daily
- - Analysis generated on
- Status : LEVEL MAINTAINED
Summary of the analysis

Additional analysis
Quotes
The USD/SGD rating is 1.3032 SGD. The price is lower by -0.53% since the last closing and was traded between 1.3017 SGD and 1.3106 SGD over the period. The price is currently at +0.12% from its lowest and -0.56% from its highest.The Central Gaps scanner detects a bullish opening marking the presence of buyers ahead of sellers at the opening but not sufficiently marked to allow the price to register a quotation gap.
Bullish opening
Type : Bullish
Timeframe : Openning
Here is a more detailed summary of the historical variations registered by USD/SGD:
New LOW record (5 years)
Type : Bearish
Timeframe : Weekly
New LOW record (1 year)
Type : Bearish
Timeframe : Weekly
Near a new HIGH record (1st january)
Type : Bullish
Timeframe : Weekly
New LOW record (1st january)
Type : Bearish
Timeframe : Weekly
Near a new HIGH record (1 month)
Type : Bullish
Timeframe : Weekly
New LOW record (1 month)
Type : Bearish
Timeframe : Weekly
Technical
A technical analysis in Daily of this USD/SGD chart shows a sharp bearish trend. The signals given by moving averages are 92.86% bearish. This strong bearish trend is confirmed by the strong signals currently being given by short-term moving averages. The Central Indicators scanner does not detect any result on moving averages that would impact this trend.
An assessment of technical indicators shows a bearish signal.
Caution: the Central Indicators scanner currently detects an excess:
RSI indicator is oversold : under 30
Type : Neutral
Timeframe : Daily
CCI indicator is oversold : under -100
Type : Neutral
Timeframe : Daily
Williams %R indicator is oversold : under -80
Type : Neutral
Timeframe : Daily
Pivot points : price is under support 1
Type : Neutral
Timeframe : Daily
Pivot points : price is under support 3
Type : Neutral
Timeframe : Weekly
Central Patterns, the market scanner focusing on chart patterns, resistances and supports found this result:
Near support of channel
Type : Bullish
Timeframe : Daily
Central Candlesticks, the scanner specialised in Japanese candlesticks, detects a bearish signal that could support the hypothesis of a small drop in the very short term:
Bearish engulfing lines
Type : Bearish
Timeframe : Daily
| S3 | S2 | S1 | Price | R1 | R2 | R3 | |
|---|---|---|---|---|---|---|---|
| ProTrendLines | 1.2006 | 1.2365 | 1.2847 | 1.3032 | 1.3054 | 1.3187 | 1.3303 |
| Change (%) | -7.87% | -5.12% | -1.42% | - | +0.17% | +1.19% | +2.08% |
| Change | -0.1026 | -0.0667 | -0.0185 | - | +0.0022 | +0.0155 | +0.0271 |
| Level | Minor | Minor | Minor | - | Major | Major | Intermediate |
Attention could also be paid to pivot points to set price objectives:
| Pivot points | S3 | S2 | S1 | PP | R1 | R2 | R3 |
|---|---|---|---|---|---|---|---|
| Standard | 1.2993 | 1.3021 | 1.3061 | 1.3089 | 1.3129 | 1.3157 | 1.3197 |
| Camarilla | 1.3083 | 1.3090 | 1.3096 | 1.3102 | 1.3108 | 1.3115 | 1.3121 |
| Woodie | 1.3000 | 1.3024 | 1.3068 | 1.3092 | 1.3136 | 1.3160 | 1.3204 |
| Fibonacci | 1.3021 | 1.3047 | 1.3063 | 1.3089 | 1.3115 | 1.3131 | 1.3157 |
| Pivot points | S3 | S2 | S1 | PP | R1 | R2 | R3 |
|---|---|---|---|---|---|---|---|
| Standard | 1.3004 | 1.3073 | 1.3116 | 1.3185 | 1.3228 | 1.3297 | 1.3340 |
| Camarilla | 1.3129 | 1.3140 | 1.3150 | 1.3160 | 1.3170 | 1.3181 | 1.3191 |
| Woodie | 1.2992 | 1.3067 | 1.3104 | 1.3179 | 1.3216 | 1.3291 | 1.3328 |
| Fibonacci | 1.3073 | 1.3116 | 1.3142 | 1.3185 | 1.3228 | 1.3254 | 1.3297 |
| Pivot points | S3 | S2 | S1 | PP | R1 | R2 | R3 |
|---|---|---|---|---|---|---|---|
| Standard | 1.3046 | 1.3200 | 1.3282 | 1.3436 | 1.3518 | 1.3672 | 1.3754 |
| Camarilla | 1.3298 | 1.3320 | 1.3341 | 1.3363 | 1.3385 | 1.3406 | 1.3428 |
| Woodie | 1.3009 | 1.3182 | 1.3245 | 1.3418 | 1.3481 | 1.3654 | 1.3717 |
| Fibonacci | 1.3200 | 1.3291 | 1.3346 | 1.3436 | 1.3527 | 1.3582 | 1.3672 |
Numerical data
The following is the status of the technical indicators and moving averages at the time of publication of this technical analysis:
| RSI (14): | 25.49 | |
| MACD (12,26,9): | -0.0096 | |
| Directional Movement: | -26.8969 | |
| AROON (14): | -85.7143 | |
| DEMA (21): | 1.3080 | |
| Parabolic SAR (0,02-0,02-0,2): | 1.3151 | |
| Elder Ray (13): | -0.0088 | |
| Super Trend (3,10): | 1.3236 | |
| Zig ZAG (10): | 1.3032 | |
| VORTEX (21): | 0.6929 | |
| Stochastique (14,3,5): | 12.34 | |
| TEMA (21): | 1.3037 | |
| Williams %R (14): | -94.53 | |
| Chande Momentum Oscillator (20): | -0.0236 | |
| Repulse (5,40,3): | -0.7629 | |
| ROCnROLL: | 2 | |
| TRIX (15,9): | -0.0902 | |
| Courbe Coppock: | 3.44 |
| MA7: | 1.3100 | |
| MA20: | 1.3220 | |
| MA50: | 1.3385 | |
| MA100: | 1.3459 | |
| MAexp7: | 1.3096 | |
| MAexp20: | 1.3201 | |
| MAexp50: | 1.3326 | |
| MAexp100: | 1.3400 | |
| Price / MA7: | -0.52% | |
| Price / MA20: | -1.42% | |
| Price / MA50: | -2.64% | |
| Price / MA100: | -3.17% | |
| Price / MAexp7: | -0.49% | |
| Price / MAexp20: | -1.28% | |
| Price / MAexp50: | -2.21% | |
| Price / MAexp100: | -2.75% |
News
Don't forget to follow the news on USD/SGD. At the time of publication of this analysis, the latest news was as follows:
-
 USD/SGD Forecast July 17, 2024
-
USD/SGD Forecast July 11, 2024
-
USD/SGD Forecast June 4, 2024
-
USD/SGD and USD/ZAR Forecast May 17, 2022
-
USD/SGD and USD/ZAR Forecast February 28, 2022
About author

Online


Add a comment
Comments
0 comments on the analysis USD/SGD - Daily