| Open: | - |
| Change: | - |
| Volume: | - |
| Low: | - |
| High: | - |
| High / Low range: | - |
| Type: | Forex |
| Ticker: | USDSGD |
| ISIN: |
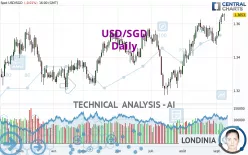
USD/SGD - Daily - Technical analysis published on 09/08/2023 (GMT)
- 226
- 0
- 09/08/2023 - 16:00
Click here for a new analysis!
- Timeframe : Daily
- - Analysis generated on 09/08/2023 - 16:00
- Status : LEVEL MAINTAINED

Summary of the analysis

Additional analysis
Quotes
The USD/SGD rating is 1.3653 SGD. On the day, this instrument lost -0.02% with the lowest point at 1.3617 SGD and the highest point at 1.3662 SGD. The deviation from the price is +0.26% for the low point and -0.07% for the high point.Here is a more detailed summary of the historical variations registered by USD/SGD:
Near a new LOW record (5 years)
Type : Bearish
Timeframe : Weekly
Near a new LOW record (1 year)
Type : Bearish
Timeframe : Weekly
Near a new LOW record (1st january)
Type : Bearish
Timeframe : Weekly
Near a new LOW record (1 month)
Type : Bearish
Timeframe : Weekly
Technical
Technical analysis of USD/SGD in Daily shows a strongly overall bullish trend. The signals given by the moving averages are 92.86% bullish. This strong bullish trend is confirmed by the strong signals currently being given by short-term moving averages. There is no crossing of moving average by the price or crossing of moving averages between themselves.
Technical indicators are strongly bullish, suggesting that the price increase should continue.
Caution: the Central Indicators scanner currently detects an excess:
CCI indicator is overbought : over 100
Type : Neutral
Timeframe : Daily
RSI indicator: bearish divergence
Type : Bearish
Timeframe : Daily
Williams %R indicator is overbought : over -20
Type : Neutral
Timeframe : Daily
Pivot points : price is over resistance 2
Type : Neutral
Timeframe : Weekly
An analysis of the price chart with the Central Patterns scanner (detector of chart patterns and resistances and supports) shows a result that can have an impact on the price change:
Near resistance of channel
Type : Bearish
Timeframe : Daily
The Central Candlesticks scanner, specialised in Japanese candlesticks, did not identify any signals.
| S3 | S2 | S1 | Price | R1 | R2 | R3 | |
|---|---|---|---|---|---|---|---|
| ProTrendLines | 1.3368 | 1.3425 | 1.3561 | 1.3653 | 1.3855 | 1.4077 | 1.4401 |
| Change (%) | -2.09% | -1.67% | -0.67% | - | +1.48% | +3.11% | +5.48% |
| Change | -0.0285 | -0.0228 | -0.0092 | - | +0.0202 | +0.0424 | +0.0748 |
| Level | Minor | Minor | Major | - | Minor | Minor | Major |
To determine price objectives, it is also possible to use the pivot points. Here is the price position in relation to pivot points:
| Pivot points | S3 | S2 | S1 | PP | R1 | R2 | R3 |
|---|---|---|---|---|---|---|---|
| Standard | 1.3616 | 1.3627 | 1.3641 | 1.3652 | 1.3666 | 1.3677 | 1.3691 |
| Camarilla | 1.3648 | 1.3650 | 1.3653 | 1.3655 | 1.3657 | 1.3660 | 1.3662 |
| Woodie | 1.3618 | 1.3628 | 1.3643 | 1.3653 | 1.3668 | 1.3678 | 1.3693 |
| Fibonacci | 1.3627 | 1.3637 | 1.3643 | 1.3652 | 1.3662 | 1.3668 | 1.3677 |
| Pivot points | S3 | S2 | S1 | PP | R1 | R2 | R3 |
|---|---|---|---|---|---|---|---|
| Standard | 1.3367 | 1.3420 | 1.3473 | 1.3526 | 1.3579 | 1.3632 | 1.3685 |
| Camarilla | 1.3498 | 1.3508 | 1.3517 | 1.3527 | 1.3537 | 1.3546 | 1.3556 |
| Woodie | 1.3368 | 1.3420 | 1.3474 | 1.3526 | 1.3580 | 1.3632 | 1.3686 |
| Fibonacci | 1.3420 | 1.3460 | 1.3485 | 1.3526 | 1.3566 | 1.3591 | 1.3632 |
| Pivot points | S3 | S2 | S1 | PP | R1 | R2 | R3 |
|---|---|---|---|---|---|---|---|
| Standard | 1.2997 | 1.3146 | 1.3328 | 1.3477 | 1.3659 | 1.3808 | 1.3990 |
| Camarilla | 1.3420 | 1.3450 | 1.3481 | 1.3511 | 1.3541 | 1.3572 | 1.3602 |
| Woodie | 1.3015 | 1.3154 | 1.3346 | 1.3485 | 1.3677 | 1.3816 | 1.4008 |
| Fibonacci | 1.3146 | 1.3272 | 1.3350 | 1.3477 | 1.3603 | 1.3681 | 1.3808 |
Numerical data
The following is the status of the technical indicators and moving averages at the time of publication of this technical analysis:
| RSI (14): | 68.32 | |
| MACD (12,26,9): | 0.0047 | |
| Directional Movement: | 10.3469 | |
| AROON (14): | 28.5714 | |
| DEMA (21): | 1.3617 | |
| Parabolic SAR (0,02-0,02-0,2): | 1.3502 | |
| Elder Ray (13): | 0.0059 | |
| Super Trend (3,10): | 1.3486 | |
| Zig ZAG (10): | 1.3652 | |
| VORTEX (21): | 1.1843 | |
| Stochastique (14,3,5): | 95.00 | |
| TEMA (21): | 1.3634 | |
| Williams %R (14): | -5.24 | |
| Chande Momentum Oscillator (20): | 0.0131 | |
| Repulse (5,40,3): | 0.5547 | |
| ROCnROLL: | 1 | |
| TRIX (15,9): | 0.0456 | |
| Courbe Coppock: | 0.47 |
| MA7: | 1.3593 | |
| MA20: | 1.3570 | |
| MA50: | 1.3450 | |
| MA100: | 1.3436 | |
| MAexp7: | 1.3610 | |
| MAexp20: | 1.3557 | |
| MAexp50: | 1.3493 | |
| MAexp100: | 1.3468 | |
| Price / MA7: | +0.44% | |
| Price / MA20: | +0.61% | |
| Price / MA50: | +1.51% | |
| Price / MA100: | +1.62% | |
| Price / MAexp7: | +0.32% | |
| Price / MAexp20: | +0.71% | |
| Price / MAexp50: | +1.19% | |
| Price / MAexp100: | +1.37% |
News
The latest news and videos published on USD/SGD at the time of the analysis were as follows:
-
05/16/2022 - 17:21
 USD/SGD and USD/ZAR Forecast May 17, 2022
-
02/25/2022 - 20:34
USD/SGD and USD/ZAR Forecast February 28, 2022
-
02/08/2022 - 21:08
USD/SGD and USD/ZAR Forecast February 9, 2022
-
04/14/2017 - 15:02
USD/SGD "To Hit 2009 Highs"
-
10/17/2016 - 12:09
USD/SGD Weakening Trend
About author
Online


Add a comment
Comments
0 comments on the analysis USD/SGD - Daily