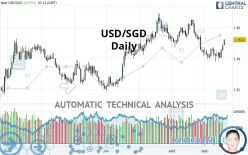
USD/SGD - Daily - Technical analysis published on 09/20/2021 (GMT)
- 257
- 0
Click here for a new analysis!
- Timeframe : Daily
- - Analysis generated on
- Status : TARGET REACHED

Summary of the analysis

Additional analysis
Quotes
The USD/SGD price is 1.3522 SGD. The price has increased by +0.27% since the last closing and was between 1.3484 SGD and 1.3524 SGD. This implies that the price is at +0.28% from its lowest and at -0.01% from its highest.The Central Gaps scanner detects a bullish opening marking the presence of buyers ahead of sellers at the opening but not sufficiently marked to allow the price to register a quotation gap.
Bullish opening
Type : Bullish
Timeframe : Openning
Here is a more detailed summary of the historical variations registered by USD/SGD:
Near a new LOW record (5 years)
Type : Bearish
Timeframe : Weekly
Technical
A technical analysis in Daily of this USD/SGD chart shows a bullish trend. The signals given by moving averages are 75.00% bullish. This bullish trend is slowing down slightly given the slightly bullish signals of short-term moving averages. An assessment of moving averages reveals several bullish signals that could impact this trend:
Bullish trend reversal : adaptative moving average 20
Type : Bullish
Timeframe : Daily
Bullish trend reversal : adaptative moving average 50
Type : Bullish
Timeframe : Daily
Bullish trend reversal : adaptative moving average 100
Type : Bullish
Timeframe : Daily
Bullish price crossover with Moving Average 20
Type : Bullish
Timeframe : Daily
Bullish price crossover with adaptative moving average 20
Type : Bullish
Timeframe : Daily
The probability of a further increase is high given the direction of the technical indicators.
Caution: the Central Indicators scanner currently detects an excess:
Williams %R indicator is overbought : over -20
Type : Neutral
Timeframe : Daily
Pivot points : price is over resistance 1
Type : Neutral
Timeframe : Daily
RSI indicator is back over 50
Type : Bullish
Timeframe : Daily
MACD crosses UP its Moving Average
Type : Bullish
Timeframe : Daily
Aroon indicator bullish trend
Type : Bullish
Timeframe : Daily
Price is back over the pivot point
Type : Bullish
Timeframe : Weekly
An analysis of the price chart with the Central Patterns scanner (detector of chart patterns and resistances and supports) shows several results that can have an impact on the price change:
Near horizontal resistance
Type : Bearish
Timeframe : Daily
Resistance of channel is broken
Type : Bullish
Timeframe : Daily
No result was found by the Central Candlesticks scanner on Japanese candlesticks.
| S3 | S2 | S1 | Price | R1 | R2 | R3 | |
|---|---|---|---|---|---|---|---|
| ProTrendLines | 1.3367 | 1.3412 | 1.3472 | 1.3522 | 1.3551 | 1.3598 | 1.3663 |
| Change (%) | -1.15% | -0.81% | -0.37% | - | +0.21% | +0.56% | +1.04% |
| Change | -0.0155 | -0.0110 | -0.0050 | - | +0.0029 | +0.0076 | +0.0141 |
| Level | Intermediate | Major | Major | - | Minor | Minor | Intermediate |
Attention could also be paid to pivot points to set price objectives:
| Pivot points | S3 | S2 | S1 | PP | R1 | R2 | R3 |
|---|---|---|---|---|---|---|---|
| Standard | 1.3413 | 1.3431 | 1.3458 | 1.3476 | 1.3503 | 1.3521 | 1.3548 |
| Camarilla | 1.3473 | 1.3477 | 1.3481 | 1.3485 | 1.3489 | 1.3493 | 1.3497 |
| Woodie | 1.3418 | 1.3433 | 1.3463 | 1.3478 | 1.3508 | 1.3523 | 1.3553 |
| Fibonacci | 1.3431 | 1.3448 | 1.3459 | 1.3476 | 1.3493 | 1.3504 | 1.3521 |
| Pivot points | S3 | S2 | S1 | PP | R1 | R2 | R3 |
|---|---|---|---|---|---|---|---|
| Standard | 1.3333 | 1.3367 | 1.3426 | 1.3460 | 1.3519 | 1.3553 | 1.3612 |
| Camarilla | 1.3459 | 1.3468 | 1.3477 | 1.3485 | 1.3494 | 1.3502 | 1.3511 |
| Woodie | 1.3346 | 1.3373 | 1.3439 | 1.3466 | 1.3532 | 1.3559 | 1.3625 |
| Fibonacci | 1.3367 | 1.3403 | 1.3425 | 1.3460 | 1.3496 | 1.3518 | 1.3553 |
| Pivot points | S3 | S2 | S1 | PP | R1 | R2 | R3 |
|---|---|---|---|---|---|---|---|
| Standard | 1.3117 | 1.3268 | 1.3355 | 1.3506 | 1.3593 | 1.3744 | 1.3831 |
| Camarilla | 1.3378 | 1.3399 | 1.3421 | 1.3443 | 1.3465 | 1.3487 | 1.3509 |
| Woodie | 1.3086 | 1.3252 | 1.3324 | 1.3490 | 1.3562 | 1.3728 | 1.3800 |
| Fibonacci | 1.3268 | 1.3359 | 1.3415 | 1.3506 | 1.3597 | 1.3653 | 1.3744 |
Numerical data
The following are the details of the technical indicators and moving averages that were collected to generate this technical analysis:
| RSI (14): | 56.75 | |
| MACD (12,26,9): | -0.0017 | |
| Directional Movement: | 0.6567 | |
| AROON (14): | 42.8571 | |
| DEMA (21): | 1.3445 | |
| Parabolic SAR (0,02-0,02-0,2): | 1.3386 | |
| Elder Ray (13): | 0.0041 | |
| Super Trend (3,10): | 1.3546 | |
| Zig ZAG (10): | 1.3515 | |
| VORTEX (21): | 0.8674 | |
| Stochastique (14,3,5): | 88.73 | |
| TEMA (21): | 1.3437 | |
| Williams %R (14): | -0.72 | |
| Chande Momentum Oscillator (20): | 0.0089 | |
| Repulse (5,40,3): | 0.6121 | |
| ROCnROLL: | 1 | |
| TRIX (15,9): | -0.0308 | |
| Courbe Coppock: | 0.37 |
| MA7: | 1.3449 | |
| MA20: | 1.3458 | |
| MA50: | 1.3529 | |
| MA100: | 1.3438 | |
| MAexp7: | 1.3465 | |
| MAexp20: | 1.3471 | |
| MAexp50: | 1.3484 | |
| MAexp100: | 1.3461 | |
| Price / MA7: | +0.54% | |
| Price / MA20: | +0.48% | |
| Price / MA50: | -0.05% | |
| Price / MA100: | +0.63% | |
| Price / MAexp7: | +0.42% | |
| Price / MAexp20: | +0.38% | |
| Price / MAexp50: | +0.28% | |
| Price / MAexp100: | +0.45% |
News
The latest news and videos published on USD/SGD at the time of the analysis were as follows:
About author

Online


Add a comment
Comments
0 comments on the analysis USD/SGD - Daily