| Open: | - |
| Change: | - |
| Volume: | - |
| Low: | - |
| High: | - |
| High / Low range: | - |
| Type: | Forex |
| Ticker: | USDSEK |
| ISIN: |
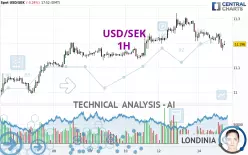
USD/SEK - 1H - Technical analysis published on 01/14/2025 (GMT)
- 63
- 0
- 01/14/2025 - 17:52
Click here for a new analysis!
- Timeframe : 1H
- - Analysis generated on 01/14/2025 - 17:52
- Status : LEVEL MAINTAINED

Summary of the analysis

Additional analysis
Quotes
The USD/SEK rating is 11.1960 SEK. On the day, this instrument lost -0.24% with the lowest point at 11.1693 SEK and the highest point at 11.2523 SEK. The deviation from the price is +0.24% for the low point and -0.50% for the high point.The Central Gaps scanner detects a bullish opening. A small advantage for buyers in the very short term.
Bullish opening
Type : Bullish
Timeframe : Openning
So that you have an overall view of the price change, here is a table showing the variations over several periods:
Near a new HIGH record (5 years)
Type : Bullish
Timeframe : Weekly
Near a new HIGH record (1 year)
Type : Bullish
Timeframe : Weekly
Near a new LOW record (1st january)
Type : Bearish
Timeframe : Weekly
Near a new LOW record (1 month)
Type : Bearish
Timeframe : Weekly
Technical
Technical analysis of USD/SEK in 1H shows an overall bearish trend. 67.86% of the signals given by moving averages are bearish. This bearish trend is supported by the strong bearish signals given by short-term moving averages. The Central Indicators scanner does not detect any result on moving averages that would impact this trend.
On the 18 technical indicators analysed, 4 are bullish, 2 are neutral and 12 are bearish. But beware of excesses. The Central Indicators scanner currently detects this:
CCI indicator is oversold : under -100
Type : Neutral
Timeframe : 1 hour
An analysis of the price chart with the Central Patterns scanner (detector of chart patterns and resistances and supports) shows several results that can have an impact on the price change:
Near horizontal support
Type : Bullish
Timeframe : 1 hour
Support of channel is broken
Type : Bearish
Timeframe : 1 hour
The Central Candlesticks scanner currently notes the presence of this pattern in Japanese candlesticks that could mark the end of the short-term trend currently underway:
White gravestone / inverted hammer
Type : Neutral
Timeframe : 1 hour
| S3 | S2 | S1 | Price | R1 | R2 | R3 | |
|---|---|---|---|---|---|---|---|
| ProTrendLines | 10.9827 | 11.0658 | 11.1331 | 11.1960 | 11.2028 | 11.2545 | 11.2935 |
| Change (%) | -1.91% | -1.16% | -0.56% | - | +0.06% | +0.52% | +0.87% |
| Change | -0.2133 | -0.1302 | -0.0629 | - | +0.0068 | +0.0585 | +0.0975 |
| Level | Minor | Minor | Intermediate | - | Intermediate | Major | Minor |
Attention could also be paid to pivot points to set price objectives:
| Pivot points | S3 | S2 | S1 | PP | R1 | R2 | R3 |
|---|---|---|---|---|---|---|---|
| Standard | 11.0480 | 11.1231 | 11.1728 | 11.2479 | 11.2976 | 11.3727 | 11.4224 |
| Camarilla | 11.1882 | 11.1996 | 11.2111 | 11.2225 | 11.2339 | 11.2454 | 11.2568 |
| Woodie | 11.0353 | 11.1168 | 11.1601 | 11.2416 | 11.2849 | 11.3664 | 11.4097 |
| Fibonacci | 11.1231 | 11.1708 | 11.2002 | 11.2479 | 11.2956 | 11.3250 | 11.3727 |
| Pivot points | S3 | S2 | S1 | PP | R1 | R2 | R3 |
|---|---|---|---|---|---|---|---|
| Standard | 10.7699 | 10.8763 | 11.0441 | 11.1505 | 11.3183 | 11.4247 | 11.5925 |
| Camarilla | 11.1365 | 11.1616 | 11.1868 | 11.2119 | 11.2370 | 11.2622 | 11.2873 |
| Woodie | 10.8006 | 10.8917 | 11.0748 | 11.1659 | 11.3490 | 11.4401 | 11.6232 |
| Fibonacci | 10.8763 | 10.9810 | 11.0458 | 11.1505 | 11.2552 | 11.3200 | 11.4247 |
| Pivot points | S3 | S2 | S1 | PP | R1 | R2 | R3 |
|---|---|---|---|---|---|---|---|
| Standard | 10.5723 | 10.6998 | 10.8869 | 11.0144 | 11.2015 | 11.3290 | 11.5161 |
| Camarilla | 10.9874 | 11.0162 | 11.0451 | 11.0739 | 11.1027 | 11.1316 | 11.1604 |
| Woodie | 10.6020 | 10.7147 | 10.9166 | 11.0293 | 11.2312 | 11.3439 | 11.5458 |
| Fibonacci | 10.6998 | 10.8200 | 10.8943 | 11.0144 | 11.1346 | 11.2089 | 11.3290 |
Numerical data
The following are the details of the technical indicators and moving averages that were collected to generate this technical analysis:
| RSI (14): | 38.90 | |
| MACD (12,26,9): | -0.0124 | |
| Directional Movement: | -15.3651 | |
| AROON (14): | -78.5714 | |
| DEMA (21): | 11.2091 | |
| Parabolic SAR (0,02-0,02-0,2): | 11.2351 | |
| Elder Ray (13): | -0.0150 | |
| Super Trend (3,10): | 11.2614 | |
| Zig ZAG (10): | 11.1967 | |
| VORTEX (21): | 0.8264 | |
| Stochastique (14,3,5): | 22.30 | |
| TEMA (21): | 11.1943 | |
| Williams %R (14): | -64.52 | |
| Chande Momentum Oscillator (20): | -0.0466 | |
| Repulse (5,40,3): | -0.0968 | |
| ROCnROLL: | 2 | |
| TRIX (15,9): | -0.0112 | |
| Courbe Coppock: | 0.59 |
| MA7: | 11.1595 | |
| MA20: | 11.0844 | |
| MA50: | 10.9881 | |
| MA100: | 10.6695 | |
| MAexp7: | 11.2058 | |
| MAexp20: | 11.2227 | |
| MAexp50: | 11.2244 | |
| MAexp100: | 11.2003 | |
| Price / MA7: | +0.33% | |
| Price / MA20: | +1.01% | |
| Price / MA50: | +1.89% | |
| Price / MA100: | +4.93% | |
| Price / MAexp7: | -0.09% | |
| Price / MAexp20: | -0.24% | |
| Price / MAexp50: | -0.25% | |
| Price / MAexp100: | -0.04% |
News
The last news published on USD/SEK at the time of the generation of this analysis was as follows:
-
08/28/2024 - 15:01
 USD/SEK Forecast August 29, 2024
About author

Online


Add a comment
Comments
0 comments on the analysis USD/SEK - 1H